
IELTS Academic Writing Task 1 – The Chart Below Shows the Average Hours Spent Per Day in Leisure and Sports Activities
You should spend about 20 minutes on this task.
Real IELTS Exam Question, Reported On:
| Uzbekistan | 07 June 2025 |
The chart below shows the average hours spent per day in leisure and sports activities by youngest and oldest population in the US in 2015.
Summarise the information by selecting and reporting the main features and make comparisons where relevant.
Write at least 150 words.
IELTS Bar Chart – The Chart Below Shows the Average Hours Spent Per Day in Leisure and Sports Activities
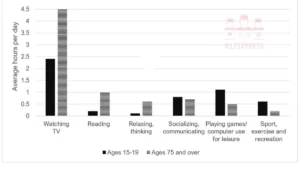
The given bar chart illustrates the average amount of time per day that people aged 15-19 and 75+ in the US spent on different activities in 2015.
Overall, it is clear that on average, watching TV consumed the most amount of leisure time for both age groups. In addition, except for socialising and communicating, there was a stark difference between the amount of time these two groups spent on each activity.
In 2015, people aged 75+ in the US spent an average of 4.5 hours per day watching TV, while those aged 15-19 spent an average of 2.4 hours. People aged 75+ also spent more time reading, at 1 hour per day, compared to the younger group, at 0.2 hours. The older group also spent far more time relaxing and thinking than the younger group, at 0.6 and 0.1 hours respectively.
On the other hand, the younger group spent over twice as much time on the computer than the older group, at an average of 1.1 and 0.5 hours respectively. Sport, exercise, and recreation was also favoured more by the younger group, with 15-19 year-olds spending an average of 0.6 hours while the older group spent around 0.2 hours. A similar amount of time was spent socialising and communicating, with both groups spending just under an hour a day on this activity.
Also Check: The Plans Show How an Office Building Was Converted to a Dental Clinic

