Graph on Nitrogen Oxide Emissions Produced by Different Vehicle
The graph illustrates the average amount of nitrogen oxide emissions produced by different types of vehicles, measured in grams per kilometer. Nitrogen oxide is a harmful pollutant primarily released from vehicle exhausts, contributing to environmental and health issues.
This visual data helps compare how much pollution is emitted by cars, buses, and trucks, offering insights into the environmental impact of various transport options.
You should spend about 20 minutes on this task.
Real IELTS Exam Question, Reported On:
| 03 May 2025 |
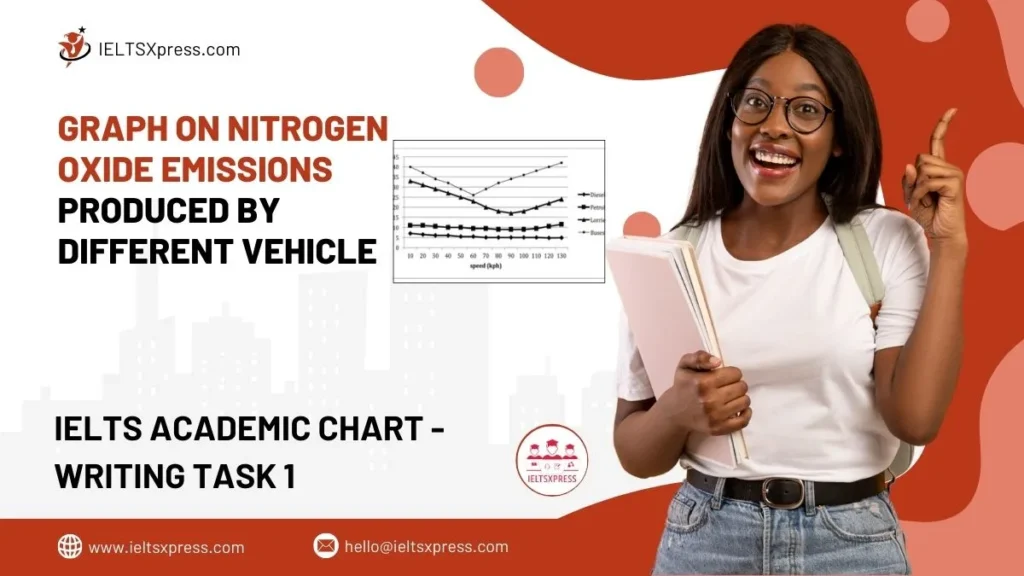
The line chart illustrates nitrogen oxide emissions produced by different vehicle types in relation to their speed.

Summarise the information by selecting and reporting the main features and make comparisons where relevant. Write at least 150 words.
Graph on Nitrogen Oxide Emissions Produced by Different Vehicle
Sample Answer 1
Overall, emissions from buses and lorries decrease as their speed increases initially, but then rise again at higher speeds. In contrast, diesel and petrol cars show relatively stable emission levels across various speeds.
Petrol cars emit around 11g of nitrogen oxide per kilometer at a speed of 10 kph. As the speed increases to 100 kph, emissions drop slightly to about 9g/km, before rising again to approximately 12g/km at 130 kph. Diesel vehicles start at roughly 7g/km at 10 kph, with emissions steadily decreasing to about 5g/km by 130 kph.
Among heavier vehicles, buses emit approximately 40g/km at 10 kph. This drops significantly to just over 25g/km at 60 kph, then climbs sharply to a peak of about 42g/km at 130 kph. Lorries start at 34g/km at 10 kph, fall to 16g/km at 90 kph, and then increase again to nearly 25g/km at the highest speed. ieltsxpress.com