Work Hours per Week in the Industrial Sector Bar Chart
You should spend about 20 minutes on this task.
Real IELTS Exam Question, Reported On:![]()
Practice with Expert IELTS Tutors Online
Apply Code "IELTSXPRESS20" To Get 20% off on IELTS Mock Test
| India | 26th November 2022 |
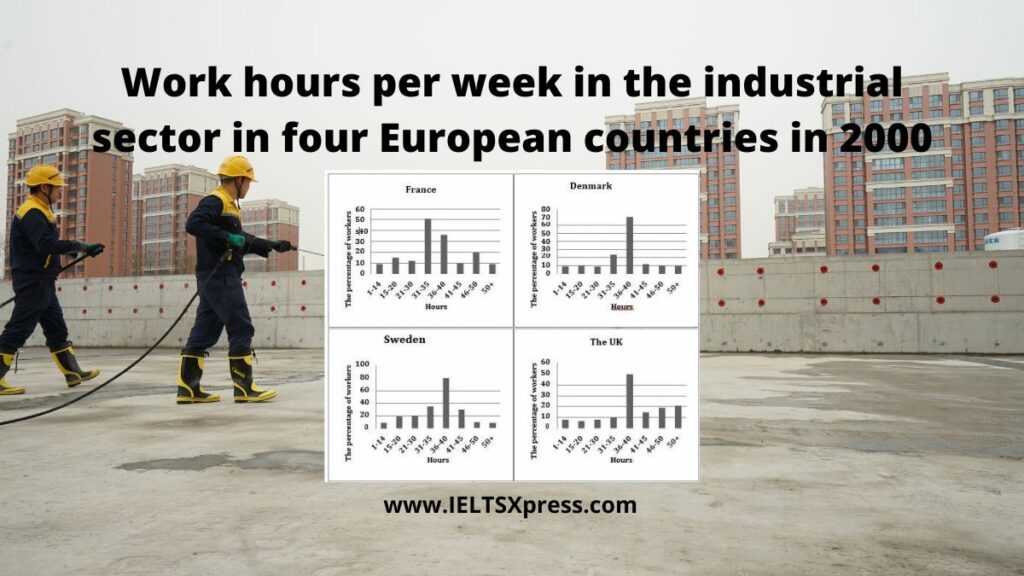
The charts below show the figure for work hours per week in the industrial sector in four European countries in 2002.
 Summarise the information by selecting and reporting the main features and make comparisons where relevant. Write at least 150 words.
Work Hours per Week in the Industrial Sector Bar Chart
Sample Answer 1
The bar graphs illustrate the number of hours spent on work per week, in industrial sectors in France, Denmark, Sweden, the UK in 2002. Overall, it is apparent that the maximum workers worked 36-4- hours and least spending time 1-14 hours, but in France, the maximum workers worked 31 to 35 hours per week.
An in-depth analysis of the bar graphs reveals that, in France, approximately, ha;f the workers work for 31 -35 and 36-40 hours, 50% and 38% respectively. Only 20% of workers are worked in 4650 hours. Other working hours are accounted for around 12%, and fewer workers each Denmark, Sweden and the UK witnessed the highest proportion of people working fr 36-40 hours, which was quite different from France. The second and third highest proportion for (31-35 and 41-45)Denmark and Sweden. Comparatively, Sweden’s little increase showed in the number of the hours who spent the time of workers almost 10%. ieltsxpress
![]() Furthermore, the percentage of workers time comparatively less in the UK workers hours and 46-50 hours and 50+ hours almost 20% of workers worked. On the other hand, comparatively, other European countries place 46-50 and 50+hours, only less than 10% witnessed by Sweden.
Furthermore, the percentage of workers time comparatively less in the UK workers hours and 46-50 hours and 50+ hours almost 20% of workers worked. On the other hand, comparatively, other European countries place 46-50 and 50+hours, only less than 10% witnessed by Sweden.
The charts below show the figure for work hours per week in the industrial sector
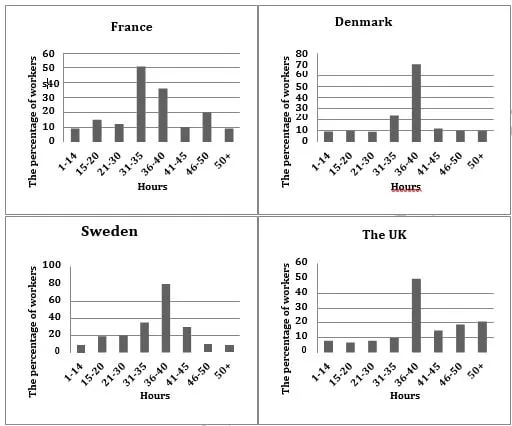
The given column graphs compare the number of hours spent on work per week by industrial workers in France, Denmark, Sweden and the UK in 2002. In three countries, it can be seen that the maximum workers worked 36-40 hours, but in France the maximum workers worked 31-35 hours per week. ieltsxpress![]()
In France, approximately half the workers worked for 31-35 hours per week. The percentage of people who worked for 36-40 hours and 46-50 hours was 35% and 20% respectively. The figures for the rest of the working hours accounted for around 10% workers each.
Denmark and Sweden witnessed the highest proportion of people working for 36-40 hours, which was quite different from that of France. The second and the third place came from 31- 35 hours and 41-45 hours workers (25% and 10% in Denmark; 35% and 30% in Sweden). The proportion of people working for the remaining hours was higher in Denmark than in Sweden.
It is interesting to note that in the UK, the percentage of people working 50+ hours was the maximum. Almost 50% worked 36-40 hours per week.
Overall, France was a country where the people worked for the least hours, where as the Swedish people spent the most time on work among the people from four different countries.
Work hours per week in the industrial sector in four European countries in 2002
The charts predicted the compare and contrast In difference the number of hours of job per week in the factory sections in France, Denmark, Sweden and the UK in 2002. ieltsxpress
In an overview in Sweden, the percentage of workers was the maximum whilst similar ratio in France and the UK.![]()
Initially, the ratio of employees who work 14 hours in France and Denmark was 10%; However, the percentage of people slightly inclined and reached 15% in France. Whilst as the figure was similar in Denmark to work for 21 – 30 hours. 50% of employees work in trade for 31 – 35 hours in France, whereas it was half of Denmark. in Denmark labourer works 36 – 40 hours was 70%, which is half of France .moreover, percentile of employees in France and Denmark was similar 10 in 50 hours. Interestingly, it was 20% in 46- 50 hours in France.
![]() Probing ahead, the workers work 36 – 40 hours in Sweden was 80% which is 30% less than in the UK .the ratio was less than 10% of 1-14, 46-50 and 50 + hours in Sweden. However, 31- 45 hours was approximately 35% workers in the UK . the figure of employees below than 10% who works 35 hours. However, 20% whose who work 50 hours. ieltsxpress
Probing ahead, the workers work 36 – 40 hours in Sweden was 80% which is 30% less than in the UK .the ratio was less than 10% of 1-14, 46-50 and 50 + hours in Sweden. However, 31- 45 hours was approximately 35% workers in the UK . the figure of employees below than 10% who works 35 hours. However, 20% whose who work 50 hours. ieltsxpress
