The Chart Below Shows Three Different Types of Crime in England and Wales
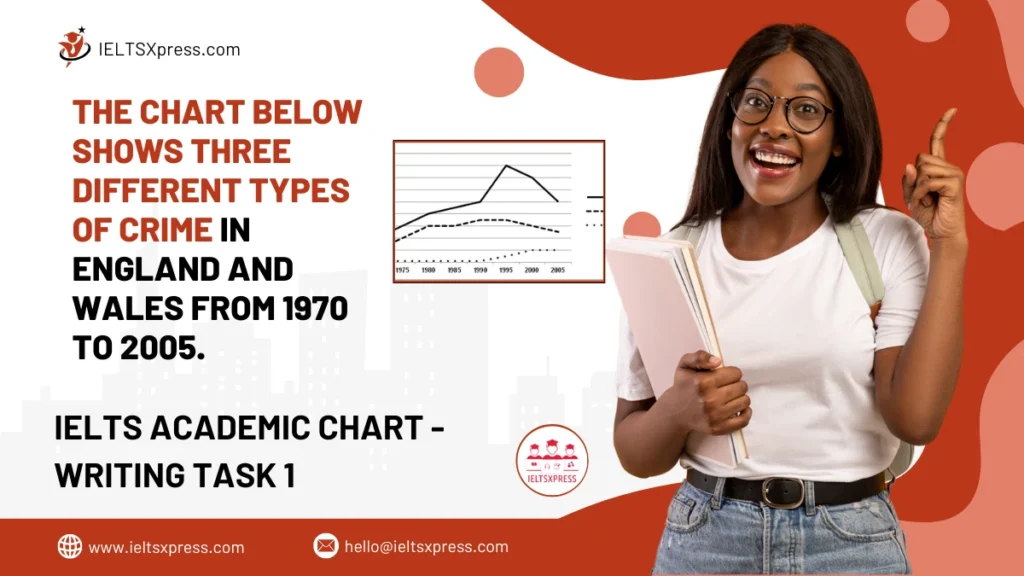
The chart below presents data on three distinct types of crime-burglary, car theft, and robbery-in England and Wales over the period from 1970 to 2005.
The trends reveal that car theft remained the most frequent crime throughout most of the years, while burglary showed a sharp rise followed by a gradual decline. Robbery incidents were comparatively low but saw a slight upward trend over the years.
You should spend about 20 minutes on this task.
Real IELTS Exam Question, Reported On:
| Uzbekistan | 19 June 2025 |
The chart below shows three different types of crime in England and Wales from 1970 to 2005. Summarize the information be selecting and reporting the main features and make comparisons where relevant.

Summarise the information by selecting and reporting the main features and make comparisons where relevant. Write at least 150 words.
The Chart Below Shows Three Different Types of Crime in England and Wales
Sample Answer 1
The line graph compares the trends in car thefts, house burglaries, and street robberies in England and Wales between 1970 and 2005.
Overall, car thefts were the most common type of crime, while street robberies were the least reported throughout the period.
Car thefts began at 0.4 million in 1970, twice the number of house burglaries. From 1970 to 1990, car thefts rose steadily to 1 million. Between 1990 and 1995, the figure increased sharply, peaking at 1.6 million. However, a significant decline followed, and by 2005, car thefts dropped to 1 million.
House burglaries showed a similar initial trend, increasing steadily for the first decade. However, after 1980, the numbers fluctuated, ultimately reaching 0.5 million in 2005. Street robberies were negligible from 1970 to 1990, with only 0.01 million cases reported. This number increased moderately to 0.2 million by 2000, remaining stable thereafter. ieltsxpress.com

