
Employment status of adults in the US in 2003 and 2013 IELTS Bar Chart
You should spend about 20 minutes on this task.
Real IELTS Exam Question, Reported On:
Practice with Expert IELTS Tutors Online
Apply Code "IELTSXPRESS20" To Get 20% off on IELTS Mock Test
| India | 4th February 2023 |
| India | 29th October 2022 |
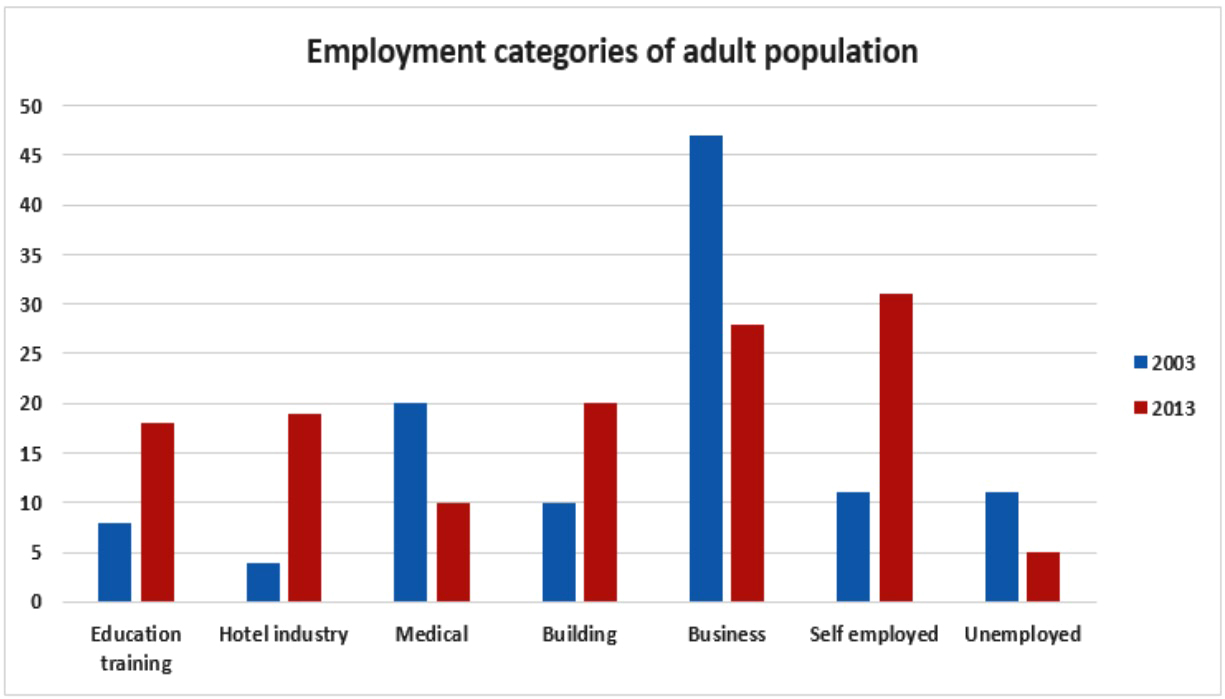
Employment status of adults in the US in 2003 and 2013
The chart shows the employment status of adults in the US in 2003 and 2013.
Summarise the information by selecting and reporting the main features and make comparisons where relevant. Write at least 150 words.
The chart shows the employment status of adults in the US in 2003 and 2013
Sample Answer 1
The given bar chart illustrates the percentage of American adults in different fields of employment from 2003 to 2013.
In general, it can be seen that there were increases in the percentages of people working in education training, the hotel industry, the building industry, and the self-employment sector, while the medical, and business sectors saw decreases over this ten-year period. The unemployment rate also significantly dropped during this time.
In 2003, approximately 8%, 3%, and 10% of American adults were employed in education training, the hotel industry, and building respectively. The figures for these fields all rose to around 20% over the following ten years. Additionally, the percentage of self-employed people almost tripled, from around 10% to just over 30% during the period.
In 2013, around a quarter of the American working population chose to run their own businesses, which had seen a two-fold decrease from 2003. Similarly, percentages of those in the medical industry also dropped by half, from 20% to 10%, over the period.
The chart shows the employment status of adults in the US in 2003 and 2013 IELTS Bar Chart
The line chart gives information about the professional status of adults in the United States from 2003 to 2013. Overall, most of the adults in the US preferred to do business in the year 2003, while in the year 2013, adults of the US like to be self-employed.
To begin with, Education training and Hotel Industry shows around 7 and 5 respectively in 2003, after a span of 10 years employment of adults population increases up to 20. On the other hand, Medical and Building Industry depicts an increase of adult population from 20 in 2003 and 10 in 2003 respectively, while the similar opposite trend is shown over a period of 10 years which accounted for 10 and 20 adult population.
Business Industry is leading among all other categories with an employment rate of around 45 in the year 2003 and then sudden decrease to approximately 27 in 2013, while self-employed category shows an increase of around 20 adult population over a period of 10 years.
Few of the US Population is unemployed, which accounted for around 1o in the year 2013 and then a decrease to 5 adult populations.
I E LT SX PRSES
IELTS Bar Chart on Employment in USA
The provided bar charts reveal the united states of America’s adolescent’s employment status in 2003 and 2013; employment status was divided into six different categories.
Overall, we can clearly see American adults dominant in employment categories year by year except for business, medical, and unemployed. In 2003 the highest number of employees was in the business field which places taken by self-employed in 2013.
For 2003, self-employed and unemployed and building categories had the same proportion of adult employees on account of a tenth. With the highest percentage business was top on the list with 46%. However, least was the hotel industry, below 5%. Education training had 7% adult population while medical had one in fifth.
After a decade, the percentage of adults was double in the building field while half on the medical side. With 5% unemployed was declined, the major population was on self-employed with three in tenth. Business categories adults population go down 18%. Education training and hotel industry employment jumped up and remained the same percentage as medical had in 2003.