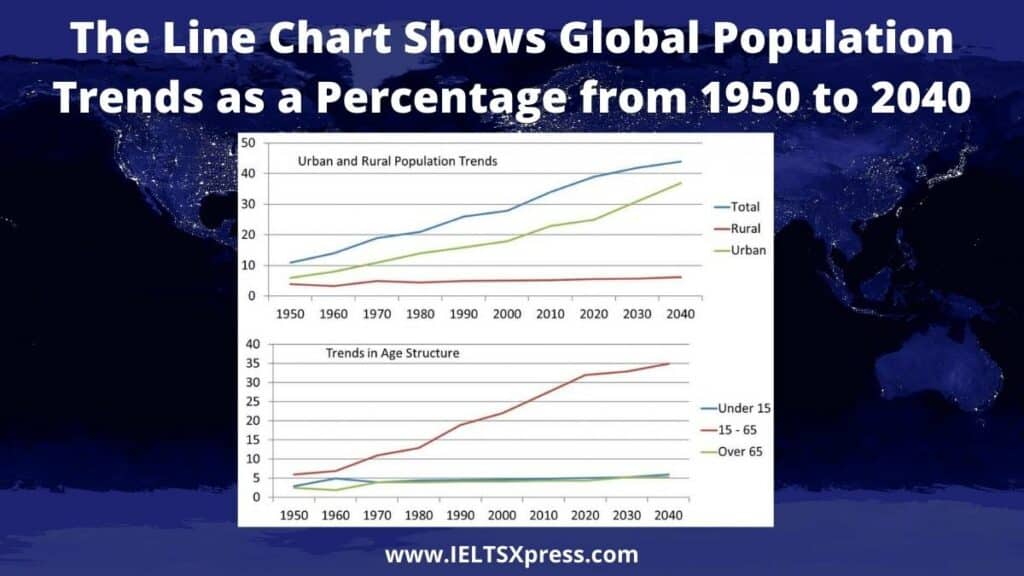
Global Population Trends Line Chart – IELTS Graph Writing
You should spend about 20 minutes on this task.
The line chart shows global population trends as a percentage from 1950 to 2040. To summarize information by selecting key characteristics and compiling a report and, if necessary, make a comparison.
Summarise the information by selecting and reporting the main features and make comparisons where relevant. Write at least 150 words.
Real IELTS Exam Question, Reported On:
| India | 19th March 2022 |
Practice with Expert IELTS Tutors Online
Apply Code "IELTSXPRESS20" To Get 20% off on IELTS Mock Test
Line chart shows global population trends as a percentage from 1950 to 2040
Sample Answer 1
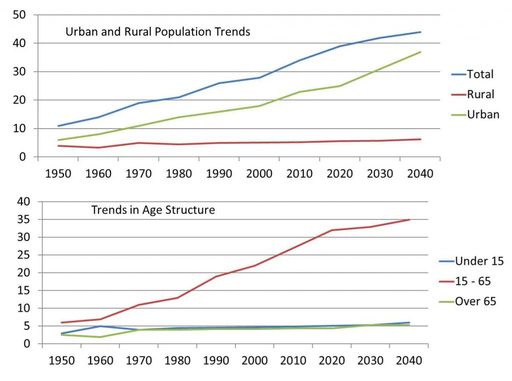
The yielded line bar charts demonstrate the percentage of urban and rural areas population trends and age-wise worldwide trends between 1950 and 2040.
Overall, it can be clearly seen that total and urban population rose will continue additionally, age group 15 to 65 people number was higher than others, and it will continue to jump up.
For area wise trends, in 1950, the total population was one in the tenth percentage, it increased dramatically, and after 70 years it was 40%. And it will take forecasting that in 2040, it touched its zenith point on account of 44%. Rural areas population proportion was only 4%, and it will remain unchanged till 2040. Moreover, a half one in the tenth percentile of the population in the Urban side, which grew later in 2020, is a quarter percentage, and after two decades, it rose 14%.
Forage trends, juveniles and golden-ager proportion were the same in 1950, and later throughout the period, both percentages were identical. After 2020 it will remain unchanged although the former touched its peak in 1960 whereas the latter one touched dip insane years. It is predicted that in 2040 the percentage will be 6%. Furthermore, age group 15 to 65 age groups had 7% which was same till 1960 but, later it goes upwards and will be 35% in 2040. I E LT SX PRSES
The chart below shows the global population trends as a percentage from 1950 to 2040
Sample Answer 2
The line charts detail population trends relating to location and age globally from 1950 until 2040. Looking from an overall perspective, it is readily apparent that urban populations have and will continue to constitute the majority of growth. In terms of age demographics, those 15-65 have become by far the largest group and this is predicted to remain the same in the future.
Turning first to urban residency in 1950, this figure began the period at 6%, just 1% above the statistic for the rural population. Over the ensuing years, urban numbers soared, rising by approximately 5% each decade until the present day. This trend is anticipated to continue and urban occupants should represent just under 40% by 2040. In contrast, rural populations were largely steady, increasing under a percentage point every 10 years and anticipated to reach 6% in 2040. The growth in total figures roughly mirror urban percentages but are 5-10% higher throughout.
The age distribution indicates clearly that those 15-65 (beginning at 6% in 1950) will become most common, rising close to 5% each decade with a likely high point of 35% by the end of the period surveyed. Those under 15 and over 65 display a broadly similar pattern at around 5% for the majority of the time described. I E L T S X P R E S S
Global Population Trends Line Chart
Sample Answer 3
The data gives demographic information about urban and rural areas as well as three particular age groups in one country from 1950 to 2000 with predictions to 2040.
Overall, the total urban and rural population witnessed a significant increase between 1950 and 2000 while the proportion of people aged 16-65 years was largest and showed the most dramatic growth compared to the figures for the other two age groups. These trends are expected to continue in 2040. IELTSXPress
The total population stood at 10% in 1950, rising to around 26% in the next 50 years, and is predicted to go up to 43% in 2040. In 1950, the urban and rural populations achieved 8% and 2.5% respectively and, in the second half of the 20th century , the figure for the countryside continued to lag that for metroplolitan areas by a significant margin of 8%. By 2040, this population disparity will have got wider with a third of the country’s population living in cities, over 20% higher than the figure for rural areas.
In the first year of the period, 7% of people in the country were 16-65-year-olds while the figures for the 0-15 and over-65 age groups stood at 4.5% and 2.5% respectively. Thereafter, the population of those aged 16-65 years over tripled in 2000, while the proportions of seniors and kids and young teenagers showed a similar upward trend, reaching 7% and 5% respectively. 27.5% of the population is expected to be 16-65-year-olds in 2040, by far higher than the respective projected figures for the elderly and 0-15-year-olds, at 9% and 5.5%.
2 thoughts on “Global Population Trends Line Chart – IELTS Writing Task 1”
I need plenty of latest question about academic IELTS writing test