Percentage of Different Age Groups of Cinema Visitors Line Graph
You should spend about 20 minutes on this task.
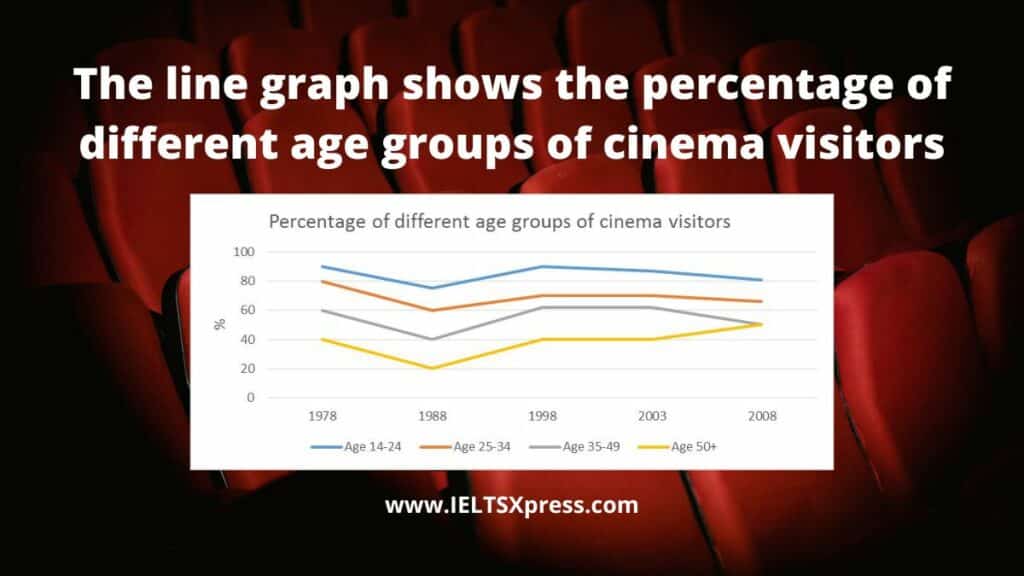
The line graph shows the percentage of different age groups of cinema visitors in a particular country from 1978 to 2008.
Summarize the information by selecting and reporting the main features and make comparisons where relevant. Write at least 150 words.
Practice with Expert IELTS Tutors Online
Apply Code "IELTSXPRESS20" To Get 20% off on IELTS Mock Test
The Line Graph Shows the Percentage of Different Age Groups of Cinema Visitors
Sample Answer 1
The given line graph illustrates the proportion of different age groups who visited theater in a particular nation from 1978 to 2008.
To begin with, during 1978, the proportion of people who belong to 50+ age group was only two fifths; however, about 90% of youngsters visited cinema in that year. In the initial year, the percentage of people who were middle-aged and aged between 24-35 years was 60% and 90% respectively. In the following decade, the proportion of older people decreased dramatically and peaked at half, but then experienced a gradual decline, reaching half that by 2008. ieltsxpress
Probing further, in the case of 35-49 years old, after a sharp decline since 1988, the proportion of people increased slightly and became equal to the proportion of older people last year, which was two-quarters. While the 25-34 age group also followed a similar trend, until 1988 the share of cinema goers reached almost three-fifths and remained stable until the last decade. Strikingly, after 1978, preference for young people also declined, but then fluctuated and reached about 85% in 2008.
The line graph shows the percentage of different age groups of cinema visitors IELTS Task 1
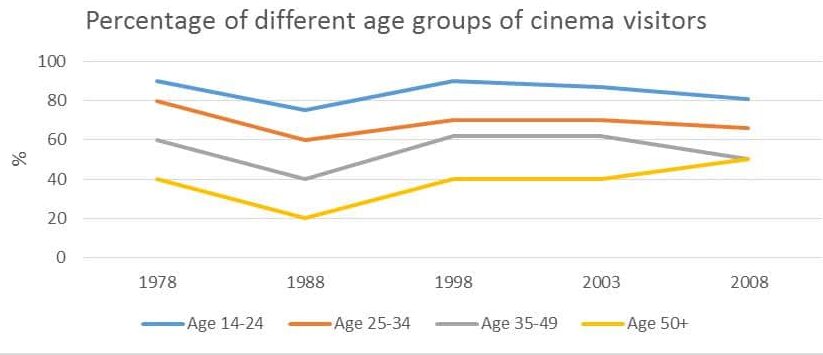
The line graph gives information about the proportion of movie goers by four age groups in a particular nation.
From 1978 to 2008, three age groups (14-24, 25-34, and 35-49)experienced a similar pattern. The young people (age 14-24) enjoyed watching movies in cinema the most, reaching 90% in 1978. Next, it declined obviously to about 75% in 1988 and grew up slightly again in following 10 years. Before a light drop in 2003, it has remained stable for 5years. Finally, it ended at nearly 82% in 2008. Likewise, to the percentage of cinema visitors (25-34), there is a significant decrease from 80% to 60%between 1978 and 1988, following a moderate increase in 1998. After that, it was stable and then fell to 65% in 2008. Similarly, the share of age group 35-49 arrived at the bottom at 40% before a considerable rise in1988. A decade later, it reached the highest point at around 62% and kept constantly until a fall from 2003. However, after 2003, more elderly people preferred to watch files in cinema, which was quite different from other three age groups. The percentage rose gradually to 50% in 2008. ieltsxpress
Overall, young people liked to watch movie in cinema the most and elderly people was the least. The tendency of movie goers’ percentage of the four age groups was quite similar between 1078 and 2003. From 2003 to 2008,the proportion of age 50+ increased while others decreased
Also Check: Tables below show Response to a Questionnaire IELTS
