Renewable Energy Total Consumption and Major Sources – IELTS Academic Writing Task 1
You should spend about 20 minutes on this task.
Write a 150-word report for a university lecturer identifying the main trends and making comparisons where relevant.
Real IELTS Exam Question, Reported On:
| India | 4th June 2022 |
Practice with Expert IELTS Tutors Online
Apply Code "IELTSXPRESS20" To Get 20% off on IELTS Mock Test
Report for a University Lecturer Identifying the Main Trends
Sample Answer 1
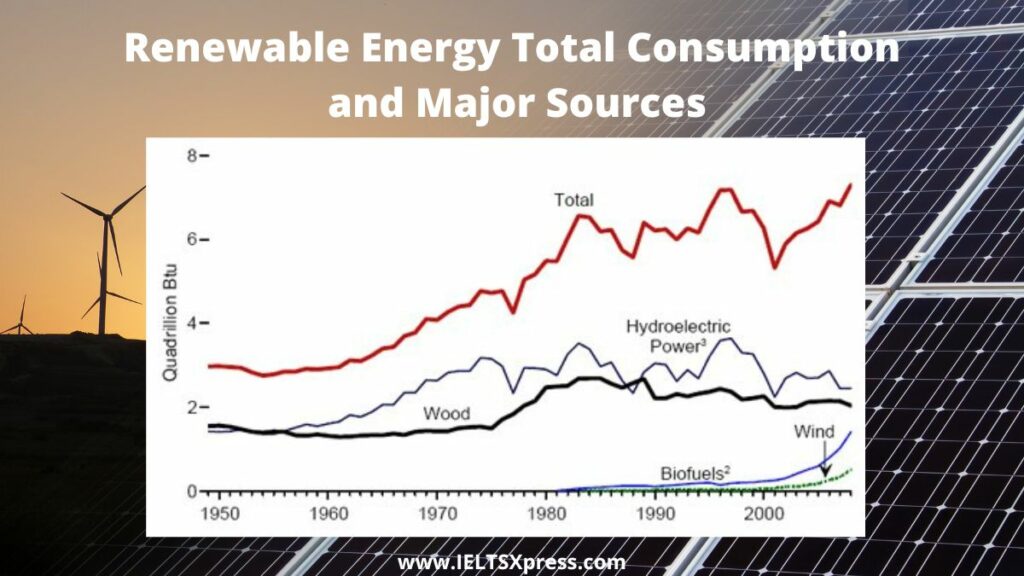
The given line graph shows the main sources through which renewable energy is produced in USA and also tells about its total consumption from 1949 to 2008.
Water and wood have been the main means of producing energy. Initially from 1950 to 1960 the energy provided by them has approximately been same being 2 Quadrillion BTU, but from 1960 to 1980, the production of hydroelectric power doubled than fuel provided by wood. This increased trend of making energy through water is consistent with the total energy usage. The generation of energy through biofuels and wind was introduced in 1980. Since then, they have made a contribution of less than 1 Quadrillion BTU in production of total energy. Yet this is a significant contribution as the overall consumption of energy increased in subsequent years reaching up to a maximum of 7 Quadrillion BTU by 2008. It just dipped in 2000 because hydroelectric power also decreased during this time, but then they both rose again.
The changing trends in gross energy consumption are consistent with the generation of hydroelectric power signifying it as the major source of energy production. Wood has been the second most important source, while biofuels and wind made little contributions.
IELTSXpress
The Line Chart Report for a University Lecturer Identifying the Main Trends
Sample Answer 2
The diagrams show how house designs differ according to climate.
The most noticeable difference between houses designed for cool and warm climates is in the shape of the roof. The designs also differ with regard to the windows and the use of insulation.
We can see that the cool climate house has a high-angled roof, which allows sunlight to enter through the window. By contrast, the roof of the warm climate house has a peak in the middle and roof overhangs to shade the windows. Insulation and thermal building materials are used in cool climates to reduce heat loss, whereas insulation and reflective materials are used to keep the heat out in warm climates.
Finally, the cool climate house has one window which faces the direction of the sun, while the warm climate house has windows on two sides which are shaded from the sun. By opening the two windows at night, the house designed for warm climates can be ventilated. ielts xpres s
IELTS Writing Task 1 Renewable Energy Total Consumption and Major Sources
Sample Answer 3
The given line chart presents the consumption as well as sources of different forms of renewable energy in the USA from 1949 to 2008. Overall, the total energy consumed in different forms show rose with many fluctuations during this period. If we see the graph in detail, we can categorise the data into two groups.
The first group includes hydroelectric power and wood energy consumption. We can see that rate of energy consumed by hydroelectric power is higher compared to wood energy. In 1949 both energy lines touch almost the same rate of consumption, which over years pass through many ups and downs and in 2008 again match the values with the difference of around point one percent.
The second group comprises bio-fuels and wind energy. Both lines show almost the same trend of stability between 1949 and 1980 and then sharp rise afterwards. In 2008 grading, the consumption of bio-fuels was little higher than the wind energy.
To summaries, we can say that hydroelectric power was the most popular source of energy and wind power was the least. The trend of all energy forms is increased overall but in an irregular manner. Another interesting thing can be noticed that consumption of wind and bio-fuels remains at zero level between 1949 and 1980.
Renewable Energy Total Consumption and Major Sources IELTS Line Chart
Sample Answer 4
The given line graph compares the consumption of main renewable energy sources in the United States of America from the year 1949 to 2008. As is observed from the graph, initially in 1950 about 3 quadrillions BTU of total renewable energy was used in the USA and this amount reached to about 8 quadrillions BTU in 2008.
As is presented in the line graph, wood and hydroelectric power were the two sources of renewable energy in the USA in 1950 and total 3 quadrillion BTU energies were consumed in the USA in this year. The consumption of renewable energy in the USA kept increasing each year with some fluctuations. In the year 2008, the consumption reached to around 8 quadrillions BTU.
Until 1982, wood and hydroelectric powers were the two main sources of renewable energy and these 2 sources provided the renewable energy for the USA people. After 1982, Bio-fuels and wind power were introduced as renewable energy sources and after then the usages of these two sources keep increasing.
To summarise, in earlier states, the wood and hydroelectric power were the main sources of renewable energy in the USA and after 2005, the usages of Bio-fuel and wind increased while the total consumption of renewable energy in the USA increased over time.
IELTS Line Chart on Renewable Energy Total Consumption
Sample Answer 5
The line graph shows growth in the consumption of renewable energy during the period 1949-2008 in the USA. The results are also broken down by source.
The first thing to note is that renewable energy use more than doubled over the period, with particularly strong growth in bio-fuels. This sector did not exist in 1980 but experienced a steep rise during the 2000s to over one quadrillion Btu per year. This made bio-fuels a serious challenger to both wood and hydroelectric power, which both saw only limited growth overall. The former grew steadily between 1975 and 1985, but then slipped back to around its original level of 1.8 quadrillion Btu. The latter began the period at the same level as wood but experienced more substantial growth. However, it also fell back to around 2 quadrillion Btu, with a particularly sharp drop in the late 1990s.
Finally, wind power emerged late in the period but showed a gradual rise to around 0.5 quadrillion Btu, suggesting that it, along with bio-fuels, will replace wood and hydroelectricity as the main sources of renewable every in the future.
IELTS XPRESS
Also Check: The Average Retirement Age for Men and Women IELTS
