The Chart below shows Annual Average Spending on Clothes per person in the US in 1985, 1995 and 2005 – IELTS Bar Chart
You should spend about 20 minutes on this task.
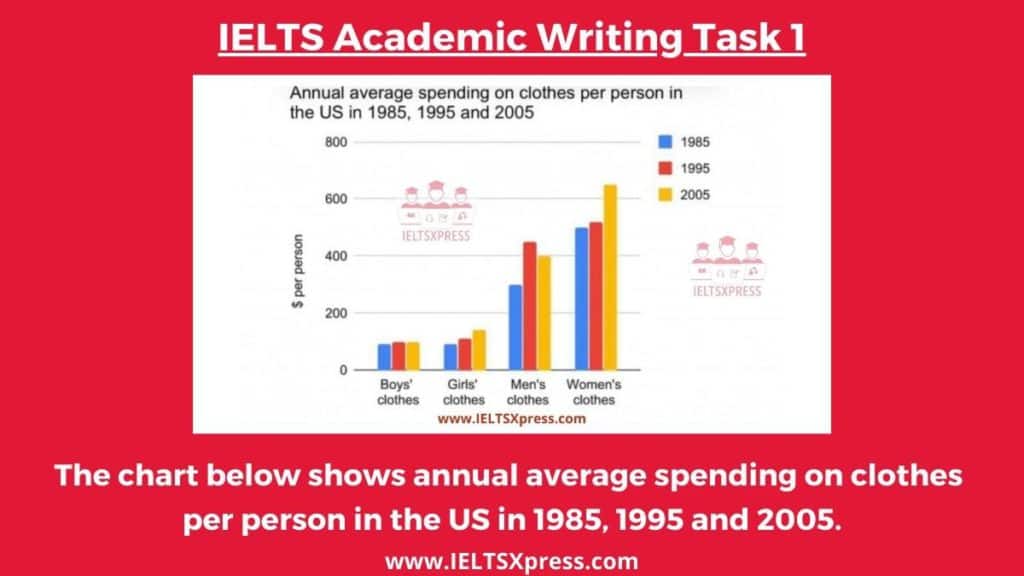
The chart below shows annual average spending on clothes per person in the US in 1985, 1995 and 2005.
Summarise the information by selecting and reporting the main features and make comparisons where relevant. Write at least 150 words.
Real IELTS Exam Question, Reported On:
| India | 7th May 2022 |
Practice with Expert IELTS Tutors Online
Apply Code "IELTSXPRESS20" To Get 20% off on IELTS Mock Test
The Chart below shows Annual Average Spending on Clothes – Sample Answer 1
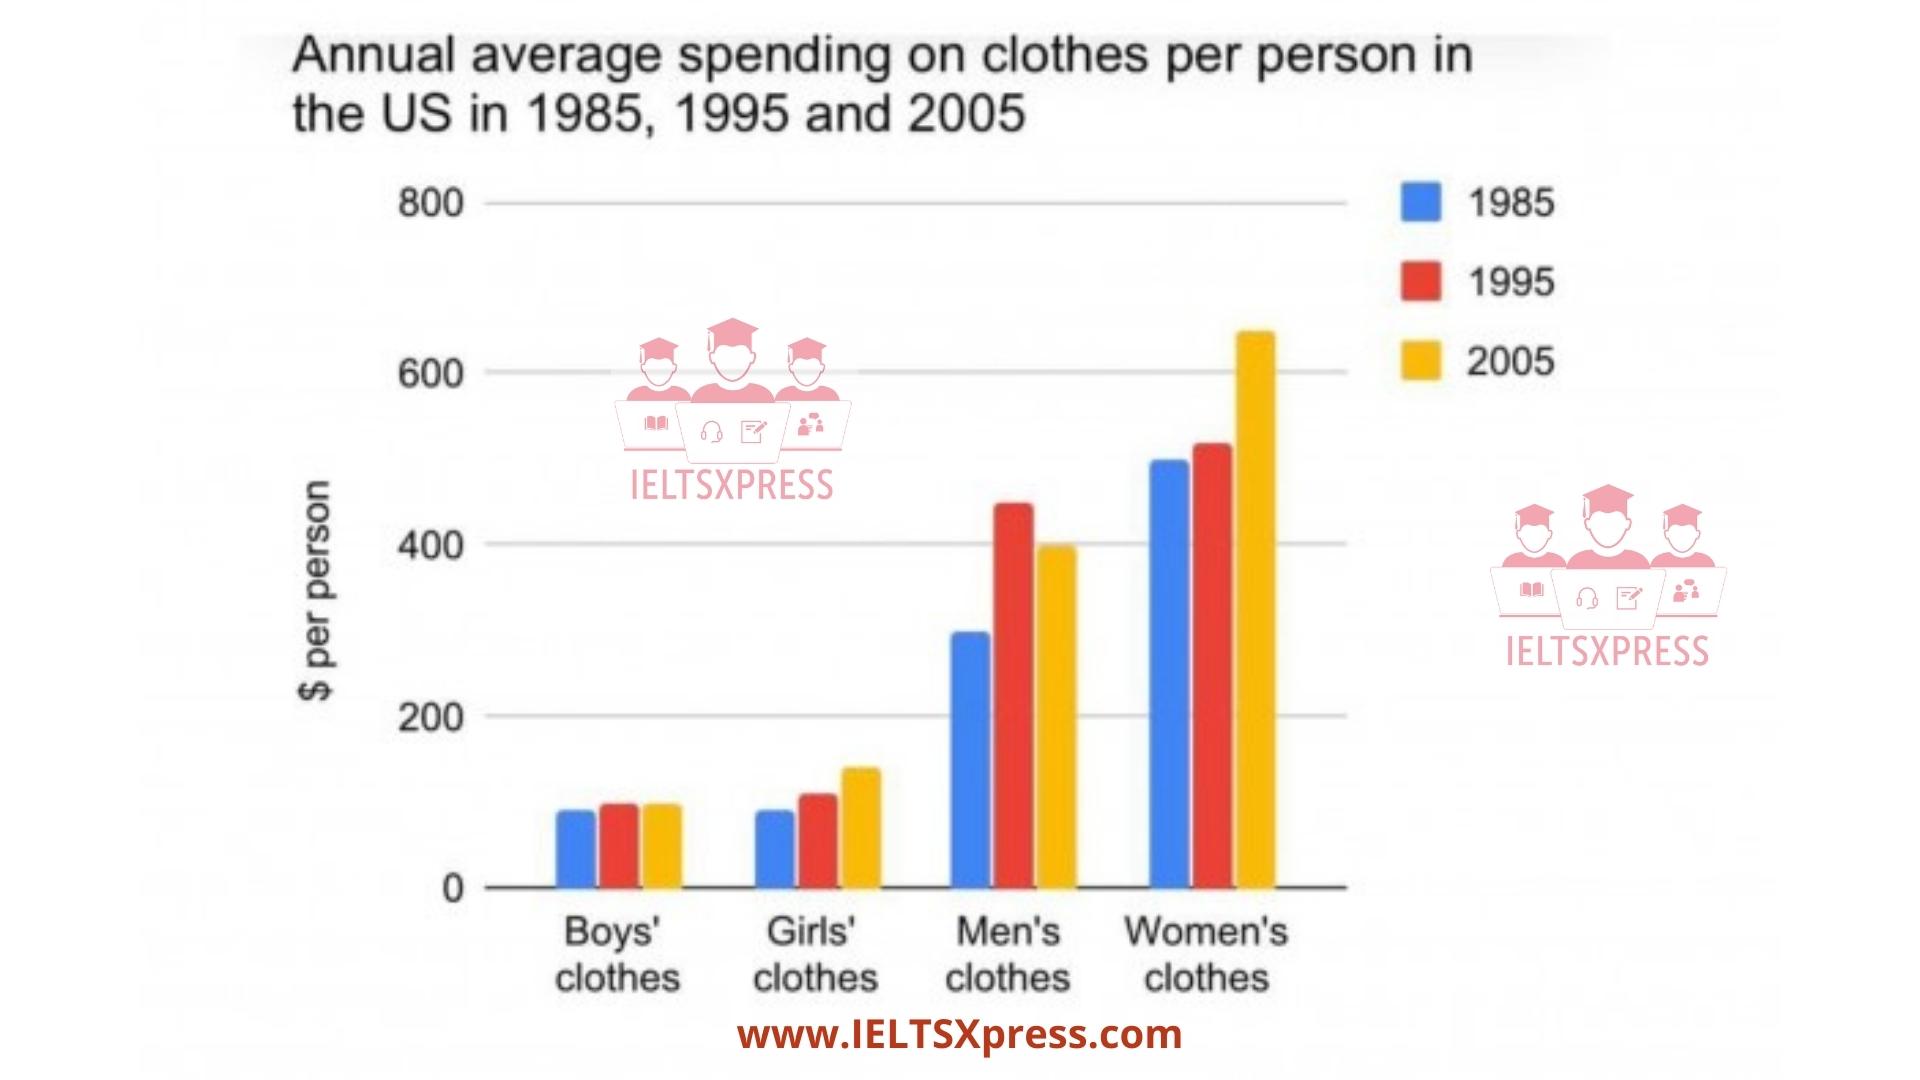
The bar chart provides information on average annual per capita clothing spending in the United States from 1985 to 2005, broken down by gender and age.
Looking at adults first, the average woman spent about $500 in 1985 and then increased significantly to about $650 in 2005. In contrast, the numbers for men were more volatile. It started at $300 in 1985 before peaking at $450 in 1995, followed by a drop to $400 at the end of the period.
Let’s turn to clothes for boys and girls, which were the least spent in the United States. While the former increased slightly from $100 in 1985 to $110 in 1995 before stabilizing over the next 10 years, the latter saw a steady increase of about $20 every decade and settled at around $150 in 2005.
Overall, there was an upward trend in the amount of money spent across all categories. Women’s and men’s clothing were the two largest items of expenditure and their expenditures increased significantly over the period, while the figures for boys and girls were significantly lower and showed relatively little growth.
Annual Average Spending on Clothes per person in the US in 1985, 1995 and 2005 – Model Answer 2
The bar chart gives information about the American yearly average clothing expenditure per capita from 1985 to 2005, organised by gender and age. Overall, all categories saw upward trends in the amounts of money spent. Women’s and men’s clothing were the two largest areas of spending and rose considerably during the period shown, whereas the figures for boys and girls were significantly lower and had comparatively small increases.
Looking first at adults, an average woman spent around $500 in 1985, which then witnessed a significant rise to roughly $650 in 2005. By contrast, the figures for men were more erratic. This started at $300 in 1985, before reaching a peak of $450 in 1995, followed by a dip to $400 at the end of the period.
Turning to boys’ and girls’ clothes, which enjoyed the least amount of spending in the US. While the former increased slightly from $100 in 1985 to $110 in 1995, before plateauing over the next 10 years, the latter observed a steady rise of approximately $20 each decade to finish at around $150 in 2005.
IELTS Bar Chart Sample – Model Answer 3
The bar chart illustrates the average amount spent yearly on clothes per person in the US in three different years.
Overall, it is clear that women spent the most on clothes while the average spending on clothes by boys and girl remains relatively constant over the period.
In 1985, women spent on average every year at about $500. This figure slightly rose about $520 in 1995, before increasing sharply to reach a peak of around $640 in 2005. In contrast, the annual expenditure on clothes by US men fluctuated. The average in 1985 was $300, then there was a dramatic growth to $430 in 1995 and it felt to $400 in 2005.
The average spent on clothes for boys and girls was much lower. The average spent boys’ clothes approximated $100 every year. However, the average spent girls’ clothes saw a slight rise. In 1985, the figure was $100 and there was a slow growth of about $120 and $150 in 1995 and 2005, respectively.
Annual Average Spending on Clothes per person in the US – Model Answer 4
The given chart shows the amount spent on clothes per person in the US over 3 years.
Overall, it is clear that there was an upward trend in average spending on clothes yearly in all 4 groups. Remarkably, only in women’s clothes did the figure for clothes’ revenue reach the highest point throughout the whole period.
As can be seen from the chart, there was a slight increase in the sales of boys’ clothes and girl’s clothes. In 1985, the payment on boys’ clothes as much as that on girls’ clothes, approximately about 100 dollars per person. 2 years later, in 1995 and 2005, spend on boy’s clothes remain stable. , customers spending on Girls’ clothes witnessed a slight climb to 150 dollars.
There was a significant climb in the revenues of Men’s clothing and women’s clothes. In the year of periods, the amount of spent on men’s clothing was above 300 dollars, while that on women’s clothing was nearly 500. the figure for spent on men’s clothes reached the peak of 450 dollars, but later dropped to 400 dollars. , a growth was seen in the sales of women’s clothes throughout the period, notably, only in 2005 did the revenue of women’s clothes reach the highest point of 650 dollars.
Also Check: The Table below illustrates How much Money a Single Person and a Couple