The Graph below shows the Population of Three Cities in 1990 IELTS Academic Writing Task 1
You should spend about 20 minutes on this task.
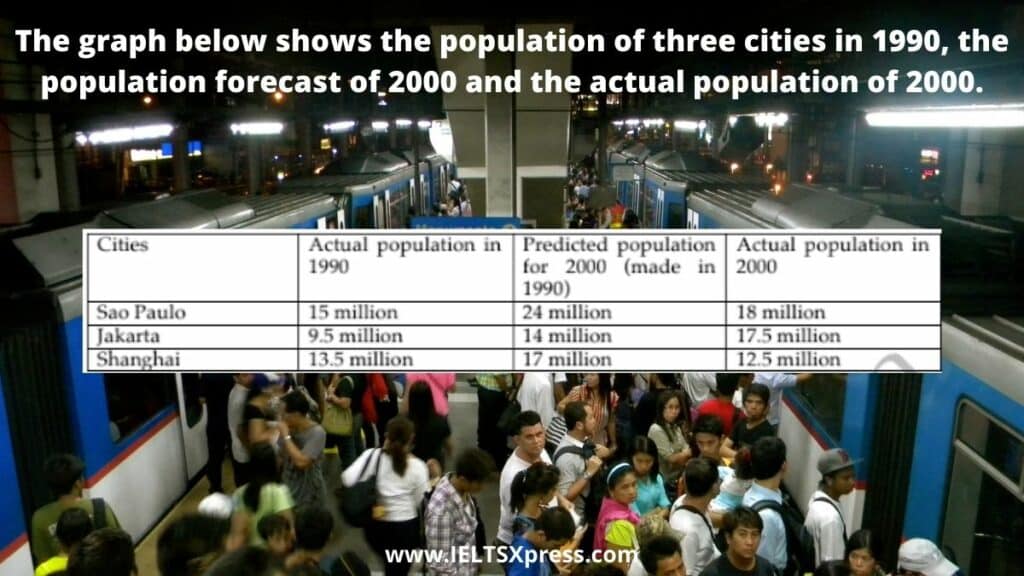
The graph below shows the population of three cities in 1990, the population forecast of 2000 and the actual population of 2000.
Summaries the information by selecting and reporting the main features, and make comparisons where relevant.
Write at least 150 words.
Real IELTS Exam Question, Reported On:
| India | 14th May 2022 |
Practice with Expert IELTS Tutors Online
Apply Code "IELTSXPRESS20" To Get 20% off on IELTS Mock Test
The Graph below shows the Population of Three Cities in 1990 IELTS
Sample Answer 1
The elicited tabular chart illustrates the information about the population of three different urban areas in 1990, the prediction of the population if 2000 and the actual number of people lived there in the year 2000. The unit of measurement is in millions.
Overall, the highest number of people lived in Sao Paulo in 1990 as well as 2000, while people were having leas interest to live in Jakarta in 1990 and Shanghai in the year of 2000. In the prediction for 2000, besides, Shangai stood at the last position.
Firstly, a total of 15 million people lived in Sao Paulo in 1990, which had increased and reached about 18 million people, which is almost 6 million less than the prediction made for 2020 in the year of 1990. ielts xpress
Secondly, Jakarta had 8 million more people in 2000 than it had in the year if 1990. Also, Jakarta was the only city among the given three cities which had approximately 3.5 million more population than its desired value for 2000.
Lastly, Shanghai showed a declination from 13.5 million actual population in 1990 to about 12.5 million actual population in 2000. Moreover, the forecast value of the population in 2000 in Shanghai was 12 million.
IELTS Writing Task 1 – Table Chart on Population
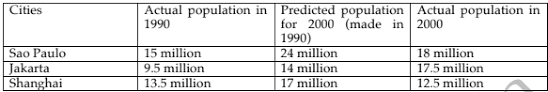
The table gives information about the actual number of inhabitants in three different cities, in 1990 and 2000 ,as well as the estimated population for 2000.
Overall, while the population of Sao Paulo and Jakarta increased between 1990 and 2000, there was a decline in the population of Shanghai. Meanwhile, Sao Paulo remained the most populous city during the period shown. ieltsxpress
In 1990, Sao Paulo recorded the highest population, at 15 million, followed by Shanghai and Jakarta, with 13.5 million and 9.5 million respectively. Although Sao Paulo’s population was predicted to reach 24 million by 2000, it only rose to 18 million. Similarly, the number of residents in Jakarta increased by 2 million in 2000, to 11.5 million, which was about 2.5 million fewer than forecasted.
There were 13.5 million people living in Shanghai in 1990 and the population was expected to experience significant growth over the next decade. However, in reality, it dropped to 12.5 million, instead of the forecasted increase to 17 million.
The Graph below shows the Population of Three Cities in 1990 IELTS
The data given in the table depicts the change in population in three cities from 1990 to 2000 in comparison with the predicted population for 2000.
In general, the population of Sao Paulo and Jakarta showed an increasing trend and that of Shanghai declined. The actual population figures significantly differed from that of the predicted figures.
Sao Paulo had the highest population in 1990 and it was 15 million. The population of this city was predicted to exponentially rise to 24 million in 2000, but the actual population showed only a marginal rise to 18 million in the same year. Likewise, Jakarta’s population was estimated to reach 14 million in 2000 from the actual rate of 9.5 million in 1990. Even though the figures inclined in 2000, it was much higher than the predicted figure and was 3.5 million more than the projection. IELTSXpress
On the other hand, the number of people in Shanghai showed a slight drop from 13.5 million in 1990 to 12.5 million in 2000 and this was in contradiction to the predicted rise to 17 million for 2000.
Also Check: Proportion of the Population aged 65 and over IELTS
