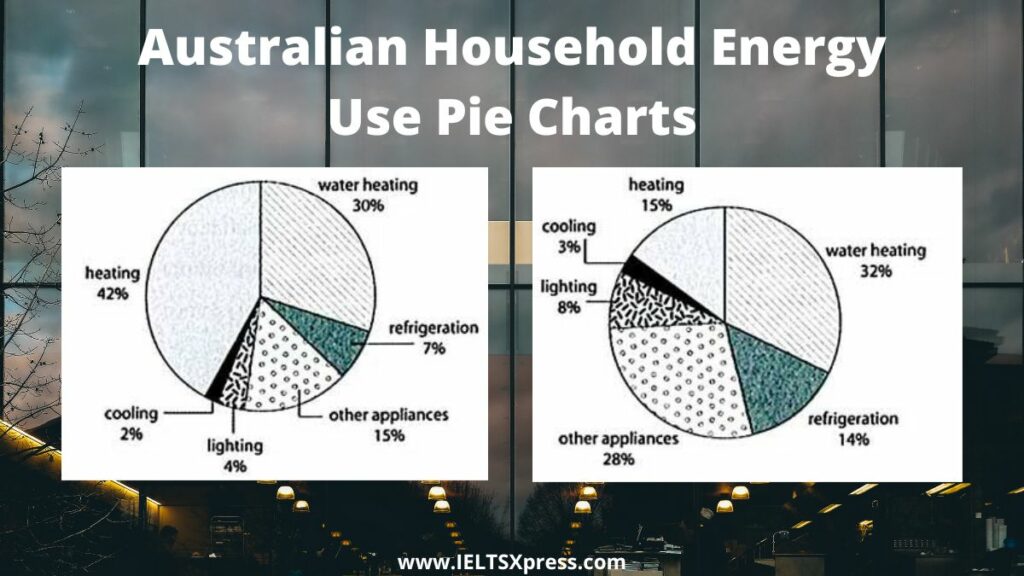
Australian Household Energy Use Pie Charts
You should spend about 20 minutes on this task.
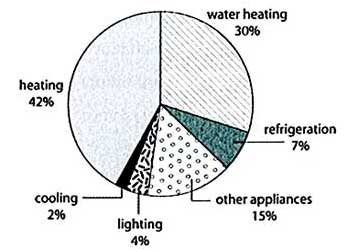
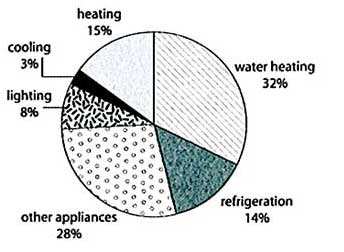
The first chart below shows how energy is used in an average Australian household. The second chart shows the greenhouse gas emissions which result from this energy use.
Write at least 150 words.
Real IELTS Exam Question, Reported On:
Practice with Expert IELTS Tutors Online
Apply Code "IELTSXPRESS20" To Get 20% off on IELTS Mock Test
| India | 18th June 2022 |
Australian Household Energy Use Pie Charts
Model Answer 1
The two charts represent the use of energy by an average Australian household and emission of greenhouse gas from the use of energy respectively. Heating and water heating are the two main uses of energy and thus contributing to a significant proportion of emission as by-product from the consumption of energy.
Heating uses slightly less than a half the energy but leads to as less as 15% of the total emission of the greenhouse gas. Followed by heating is the water heating, consuming up to one-third of the energy and leading to 32% of the hazardous emission. ieltsxpress
Strikingly, the refrigerator uses only 7% of the total energy but pollutes in the exactly double proportion. Meanwhile, the relation between use of energy and emission of harmful gas by other appliances also show similar results as only 15% of the energy is consumed while emitting almost a quarter of the total greenhouse gas.
Energy is used in an average Australian household IELTS Writing Task 1
Model Answer 2
The amount of energy consumed by various household activities in Australia and the proportion of greenhouse gas emission resulting from this are picturised in the given pie charts.
It is clear from the first chart that, an average Australian household uses the highest amount of energy (42%) for heating, which is 12% more than the energy consumed for water heating. Refrigeration, lighting and cooling consume just under one-sixth of the total energy consumption of an Australian household (7%, 4%, 2% respectively), whereas, cooling consumes the least amount of energy. The share of energy consumption by means of other appliances is also seen similar (15%).ieltsxpress
Turning to the proportion of greenhouse gas emission, refrigeration and lighting is seen emitting 14% and 8%, which is exactly the double of the energy they consume. Nearly one-third of the gas emission is attributed to water heating, which is the highest and is over double than emission by means of refrigeration and heating. The proportion of gas emitted by cooling accounts to just 3%, whereas the emission from other appliances is 28% out of the total proportion (Second highest cause of greenhouse gas emission).
Overall, it can be seen, the rate of Australian household energy used and greenhouse gas emission has no co-relation in between.
Australian Household Energy Use Pie Charts
Model Answer 3
These two pie charts show information about household energy use in Australia and the resulting greenhouse emissions. While heating is the greatest use of energy, it is not the greatest producer of greenhouse gases. Greenhouse gases are produced by water heating more than any other source.
The first pie chart displays information about the use of energy in the average Australian house. Here, heating requires the most energy, at 42% of the total, followed by water heating at a little over a third. The smallest fraction is cooling at just 2% of the total energy use. ieltsxpress
Surprisingly, while heating uses 42% of the total energy use, it only causes 15% of the total greenhouse gases. However, water heating is more or less proportional to its total use, producing a little less than a third of the greenhouse gases emitted by the average household. Refrigeration produces 14% of the total emissions, despite only using 7% of the house’s energy.
The first chart shows how energy is used in an average Australian
Model Answer 4
The first pie chart illustrates the average usage of energy in housing in Australia. while the other provides information about the emission of greenhouse gas due to such consumption of energy.
Overall, a significant majority of energy was consumed for heating in contrast with a trivial amount of it was used up for cooling purposes. Nevertheless, most of the harmful gases were emitted by heating water. ieltsxpress
With regards to the usage of energy, heating took around 42% of energy, while water heating consumed just under one-third of the total energy. Cooling consumed the least energy, just 2 % which was half of the amount used for lighting. Refrigeration consumption was about 7% and the remaining contributed to other appliances.
Water heating, which was dominant in liberating greenhouse gas, released around 32% that was approximately double the emission from refrigeration and heating. Cooling contributed to the smallest proportion of emission (about 3%) which was almost 5% less than that from lighting. The left out 28% came from other appliances.
Australian household energy use task 1
Model Answer 5
The two pie charts demonstrate the energy consumption in an average Australian household and the release of greenhouse gas generated from this energy utilization respectively.
A close look at the charts reveals that other appliances cause considerably large amount of greenhouse gas while heating being the lowest contributor in terms of energy usage to generation of hazardous gas ratio. It is also clear that the proportion of gas discharged by lighting is twice the amount of energy it consumes.
Heating makes up the highest proportion of energy usage at 42% while water heating consumes 30% of energy. Energy utilized for refrigeration is 7% which is about half of that consumed by other appliances (15%). Lighting and cooling consumption of energy stand at 4% and 2% respectively. ieltsxpress
The second chart illustrates that 32% of greenhouse gas emission is caused by water heating whereas heating releases only 15% of gas. Refrigeration causes 14% of emission while other appliances contribute twice that amount – 28%. Lastly, the amounts of greenhouse gas discharged by lighting, and cooling are 8% and 3% respectively.
Also Check: Renewable Energy Total Consumption and Major Sources