Average Monthly Temperatures in Three Major Cities – IELTS Line Graph
You should spend about 20 minutes on this task.
Real IELTS Exam Question, Reported On:
| India | 7th May 2022 |
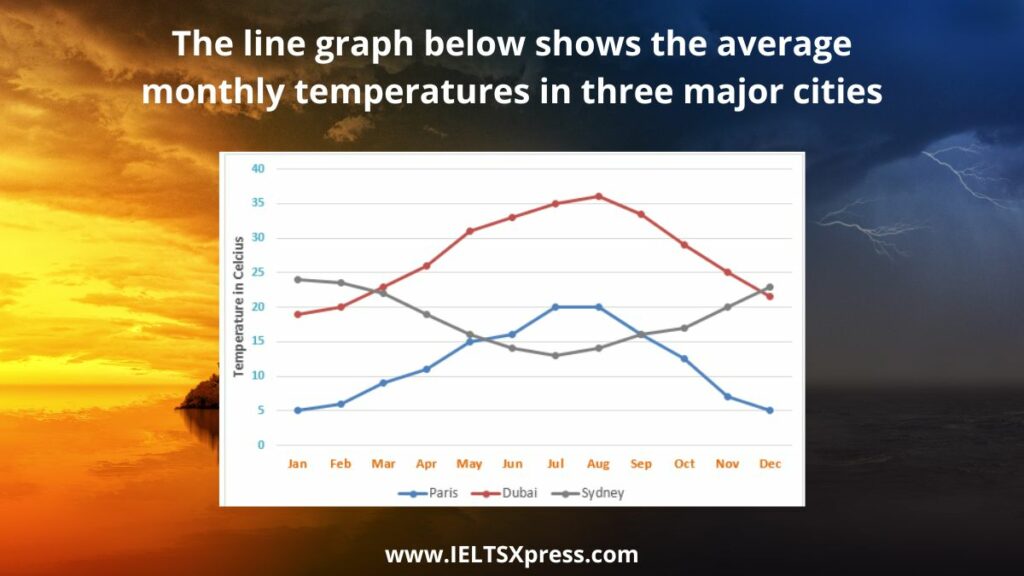
The line graph below shows the average monthly temperatures in three major cities.
Summarize the information by selecting and reporting the main features and make comparisons where relevant. Write at least 150 words.
Practice with Expert IELTS Tutors Online
Apply Code "IELTSXPRESS20" To Get 20% off on IELTS Mock Test
The line graph below shows the average monthly temperatures in three major Cities
Sample Answer 1
The average monthly temperature of three cities – Paris, Dubai and Sydney, is given in the bar graph and the data compares how the temperature in these cities changes throughout the year. The temperature is measured in Celsius. Overall, Dubai and Paris have a comparatively warmer condition between April and August while an opposite trend is witnessed in Sydney where first two and last two months of the year have a higher temperature.
As the illustration suggests, the temperature in Sydney in roughly 25-degree centigrade in January which is the warmest month of the year there. At that time, the temperature in Dubai is just below 20-degrees, which is the coldest month of the year in this city. With 5-degree centigrade, Paris at that time behold the coldest month of the year. ieltsxpress
The temperature in Sydney remains above 20-degree till mid-March and then it keeps falling till July when it has nearly 13 centigrade temperature, the coolest. Through the rest of the year, the temperature there steadily increases before reaching 23-degree in December. Conversely, Paris’s temperature remains below 20-degrees throughout the year except in July and August. Paris seems like the coldest city among the three. Finally, the temperature in Dubai reaches as high as 36-degree centigrade in August and this city has a warmer condition from April to October.
Average monthly temperatures in three major Cities IELTS Graph
Sample Answer 2
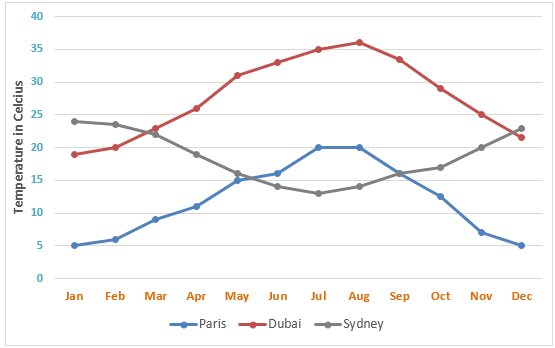
The line graph provides information about how the mean monthly temperatures vary in Paris, Dubai and Sydney over the course of a year.
One striking feature of the graph is that Paris experiences its lowest temperatures in December/January. In the following six months, the mercury rises gradually and hits its peak at 20°C in July/August. From September onwards, the figures drop steadily before reaching their minimum value of around 5°C in December/January. Interestingly, the temperature patterns for Dubai are similar to Paris, although it has warmer winters and hotter summers. The lowest and highest temperatures in Dubai are around 20°C and 36°C respectively.
On the other hand, the temperature variations in Sydney are opposite to that observed in Paris and Dubai. Sydney has its hottest weather in December/January when the mercury hovers around 23°C. In the next six months, there is a gradual decline in the mercury levels which reach their lowest level of nearly 13°C in July. Thereafter, the temperature follows an upward trend until December. ieltsxpress
Overall, the mean monthly temperatures are the highest in Dubai and are the lowest in Paris. In comparison, Sydney has moderate mercury levels throughout the year.
The line graph below shows the average monthly temperatures in three major cities
Sample Answer 3
The line graph displays the changes in temperature in three cities (Paris, Dubai and Sydney) in different months of a year. Temperature is measured in Celsius degree.
Overall, the weather pattern in Sydney is quite the opposite of Dubai and Paris. Furthermore, Paris is the coldest city among the three.
To begin with, the temperature in Paris never goes above 20 degrees. In contrast, Dubai seldom sees its temperature below this level, except for January (19 degree C). However, despite the striking differences, the temperatures in Paris and Dubai still have some similarities, as they rise continually from the beginning of the year to reach a peak in August. The highest temperature in Paris and Dubai are 20 and 36 degrees, respectively. Afterwards, both cities became colder and the temperature fell steadily. As can be seen, the differences in temperature between August and December in both Paris and Dubai are the same, 15 degrees celsius.
Regarding Sydney, it witnesses 24 degree temperature in January. From there, the temperature drops continuously before going down to the lowest point of 14 degrees in July. The five remaining months see the temperature increase dramatically, to reach 23 degrees by the end of the year.
Also Check: US Government spending on Research between 1980 and 2008
