US Government spending on Research between 1980 and 2008
You should spend about 20 minutes on this task.
The graph below gives information about U.S. government spending on research between 1980 and 2008.
Summaries the information by selecting and reporting the main features, and make comparisons where relevant.
Write at least 150 words.
Real IELTS Exam Question, Reported On:
| India | 19th January 2023 |
| India | 7th May 2022 |
| India | 23rd April 2022 |
Practice with Expert IELTS Tutors Online
Apply Code "IELTSXPRESS20" To Get 20% off on IELTS Mock Test
US Government spending on Research between 1980 and 2008
Sample Answer 1
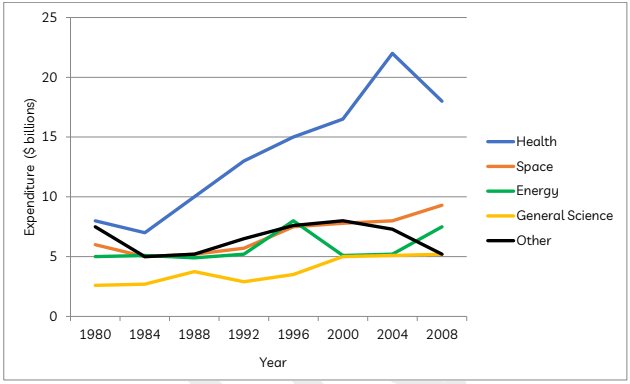
The line graph provides information about the U.S government’s expenditure on research in five fields (Health, Space, Energy, General Science and Other) over the period from 1980 to 2008.
It can be clearly seen that the US government spent the largest amount of money on research into Health while the least amount of money was spent on researching General Science. ieltsxpress
Starting at $10 billion in 1980, the government expenditure on research into Health slightly dropped over the next four years before continually rising again to a peak of nearly $25 billion in 2004. Despite declining back down to approximately $18 billion in 2008, expenditure on Health research was by far the highest. The amount of money spent on researching General Science however was the lowest of all research categories, beginning at $2.5 billion in 1980 and rising to just over $5 billion by 2008.
Meanwhile, there was also an increase in the money that was spent on research into Energy and Space, from approximately $5 billion and $6 billion in 1980 to around $7.5 billion and $9 billion in 2008, respectively. In contrast, the only field that experienced an overall decrease in expenditure was that of research into other areas, which fell from approximately $7.5 billion in 1980 to about $5 billion
by 2008.
IELTS Writing Task 1 – Line Chart US Government spending on Research between 1980 and 2008
The line chart illustrates how US government spent on different factors of research from 1980 to 2008.
Overall, there was an increase in the amount of money invested in health, space, energy, general science projects in the US while national budget allocated on other projects saw a decline. In addition, the fund spent on health factor consistently had the highest figure during the period.
The amount of money expended on health projects started at about $8m after which it witnessed a jump and peaked of around $22m in 2004 before ending the period at roughly $18 despite a small fall in the first 5 years. A similar pattern, but to a lesser extent, can be seen in the figure for Space, increasing from about $6m to almost $10m in 2008. Registering at about $3m in 1980, national budget was spent on science projects saw a small rise to $5m in 2000 before levelling off till the end of the period. ielts x rpe s s
$5m was consistently allocated on Energy projects in US from 1980 to 1992, with a subsequent fluctuation in the range from $5m to 8% and a final uptrend about a $7m in 2002. In the meantime, the annual national budget spent on other projects decreased from about $7m in 1980 to $5m before fluctuating in the range from $5m to $7.5m from 1988 onwards. ieltsxpress
Also Check: Results of a Survey conducted by a University Library