Present and Planned Development in the Biomedical Campus IELTS Academic Writing Task 1
You should spend about 20 minutes on this task.
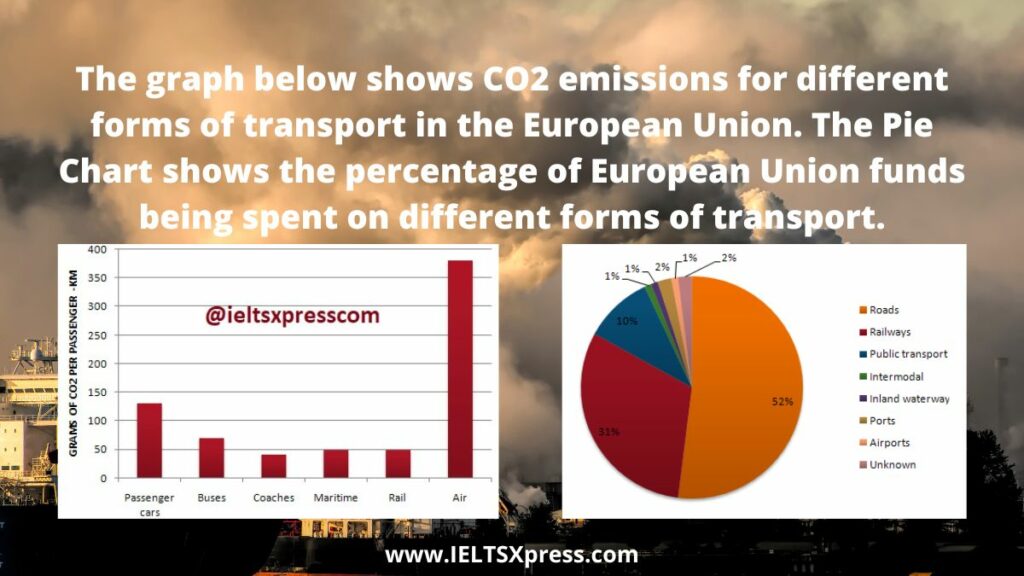
The graph below shows CO2 emissions for different forms of transport in the European Union. The Pie Chart shows the percentage of European Union funds being spent on different forms of transport.


Write at least 150 words.
Real IELTS Exam Question, Reported On:
Practice with Expert IELTS Tutors Online
Apply Code "IELTSXPRESS20" To Get 20% off on IELTS Mock Test
| India | 16th July 2022 |
CO2 Emissions for Different Forms of Transport IELTS Task 1
Sample Answer 1
The Bar Chart shows CO2 emissions for different forms of transport in the European Union.
The Pie Chart shows the percentage of European Union funds being spent on different forms of transport. ieltsxpress
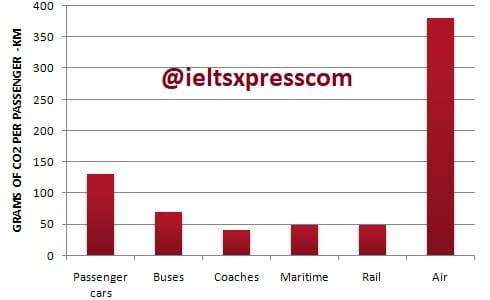
According to the first bar graph, aero planes release the highest amount of CO2 in European Union countries which is about 380 grams per passenger kilometer. The second largest Carbon Dioxide producing vehicle type is passenger car that produce around 130 grams of CO2 per passenger kilometer. Coaches, Maritime and Rail transportation release comparatively less (around 50 gm.) CO2 per passenger km. Buses release over 50 gm. CO2 per passenger km and this is comparative safer than the aero plane and personal car in terms of CO2 emission.
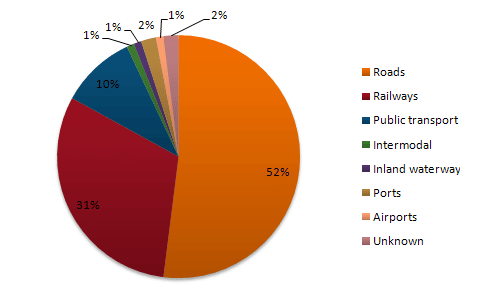
As is given in the pie chart, more than half of the total CO2 emission in EU countries are caused due to the road transportation as the number of roads transportation must be greater in number. Rails contribute to about one third of total CO2 release while public transportation produces 10% of total CO2 productions. All other transportation types (airplanes, ports, inland water transportation, inter-modal etc.) combinedly contributes to less than 10% of total CO2 emission.
The graph below shows CO2 emissions for different forms of transport in the European Union IELTS Bar Chart
Sample Answer 2
Information regarding the proportion of CO2 emissions from various transportation modes in the European Union and the share of allocation of funds on different transportation forms is depicted in the given charts.
Overall, it is clear that the expulsion of CO2 is much higher by an air traveller than a passenger who uses road, rail or waterway. It is also clear that a much greater proportion of money is spent on roads and railways than other transportation modes.
As per the bar chart, air travellers pollute the atmosphere the most. An average air traveller emits about 370 grams of CO2 per kilometre. This is almost 240 grams more than a person uses a passenger car. The average share of CO2 emissions from other transportation modes: buses, coaches, maritime and railways hovers around 50 grams per passenger.
Turning to the pie-chart, the lion’s share of fund allocation goes to road construction and maintenance. This just crosses 50% of the total amount spent, and is 21% more than the amount spent on railways (31%). A tenth of the total fund allocation goes to public transport, whereas the remaining share accounts for just 7%. IELTSXpress
IELTS Combination Chart
The graphs outline the amount of Carbon dioxide emission per passenger from different vehicles in the European Union and the EU expenditures on different modes of transportation. Overall, the highest amount of CO2 per person is emitted by the Air transports and the European Union spends the highest percentage of funds for the road transportation system.
According to the bar graph, a single passenger of a personal car is responsible for around 130 gm of CO2 per kilometre while a passenger in a bus contributes to 65 gm CO2 eruption per kilometre. Coaches, maritime and rail passengers emit the lowest amount of CO2 which is about 50 grams per passenger. Finally, an aeroplane traveller contributes to 370 km of CO2 per kilometre which is the highest.
Based on the pie chart, the European Union spent the highest amount (52%) on the road transportation system while spent only 1% to 2% on ports, waterway airport intermodal and other transport systems. They spent 31% on the rail system and 10% on the public transportation system. This indicates the European Union spent the majority of the budget on public transportations.
IELTS Bar Chart on CO2 Emission
The bar graph presents comparative data on the amount of CO2 eruption per passenger kilometre travel in different modes of vehicles while the pie chart shows the ratio of the European Union’s spending on these forms of transportation. As is clear from the given illustration, Carbon dioxide discharge per passenger in the air travel is significantly higher than any other mode of transportation and more than half of the European Union’s spending goes on the road transport system.
According to the given bar graph, more than 350 grams of CO2 ejection happens when a passenger travels one km in an aeroplane. This Carbon dioxide emission is quite higher than any other form of transportation. The second highest CO2 release is caused by private cars which are responsible for discharging about 130 gm of CO2 per passenger km. Buses, maritime and rails are responsible for the release of around 50 grams of CO2 per passenger. Finally, coaches are the most eco-friendly transportations as they emit less than 50 grams of Carbon dioxide per passenger kilometre.
On the other hand, the pie chart depicts the fund being spent on different modes of transportation types and it is obvious that more than half of their spending goes on roads. Railways get the second highest funding which is 31%. Public transportation funding amounts 10% while all other transportations’ EU budget amounts less than 10% costs. ieltsxpress
IELTS Pie Chart
The column graph shows the amount of CO2 release from different means of transports in the European Union and the pie chart outlines how the European Union distributes its budget on different transportation types. In general, air transports emit the highest volume of C02, and vehicles on roads and railways together consume most of the European Union’s expenditure budget on transports.
To begin with, nearly 400 grams of CO2 ejection happens when a passenger travels a kilometre in an aeroplane. Following that, personal cars stand at the second position with a remarkably lower figure of CO2 emision – approximately 130 grams per passenger kilometre. Buses are responsible for 70 grams of emission while this figure is 40 grams for coaches, which is the lowest. Finally, the Maritimes and rails are reported to have the same volume of CO2 discharge, 50 grams for a kilometre travel by a passenger.
As can be seen from the pie chart, more than half of the transport related expenditure by the EU goes to road transports. Nearly one-third of their total budget is spent on railways and a tenth is used for bus communications. The remaining 7% budget is then spent on other transportation types.
CO2 Emissions for Different Forms of Transport IELTS Task 1
The graphs outline the amount of Carbon dioxide emission per passenger from different vehicles in the European Union and the EU expenditures on different modes of transportation. Overall, the highest amount of CO2 per person is emitted by the Air transports and the European Union spends the highest percentage of funds for the road transportation system. ieltsxpress
According to the bar graph, a single passenger of a personal car is responsible for around 130 gm of CO2 per kilometre while a passenger in a bus contributes to 65 gm CO2 eruption per kilometre. Coaches, maritime and rail passengers emit the lowest amount of CO2 which is about 50 grams per passenger. Finally, an aeroplane traveller contributes to 370 km of CO2 per kilometre which is the highest.
Based on the pie chart, the European Union spent the highest amount (52%) on the road transportation system while spent only 1% to 2% on ports, waterway airport intermodal and other transport systems. They spent 31% on the rail system and 10% on the public transportation system. This indicates the European Union spent the majority of the budget on public transportations.
Also Check: Present and Planned Development in the Biomedical Campus


