Results of a Survey conducted by a University Library – IELTS Academic Writing Task 1
You should spend about 20 minutes on this task.
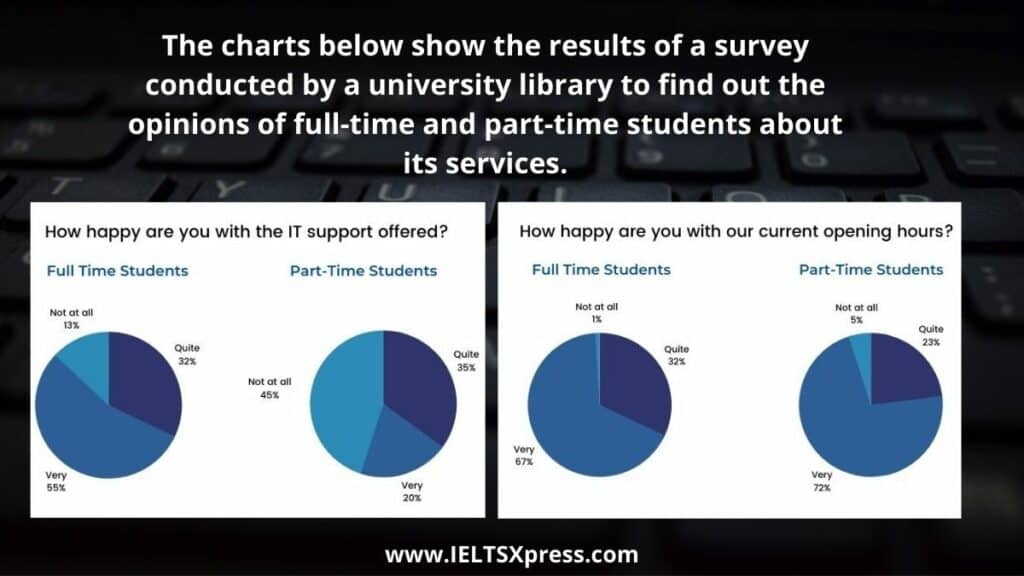
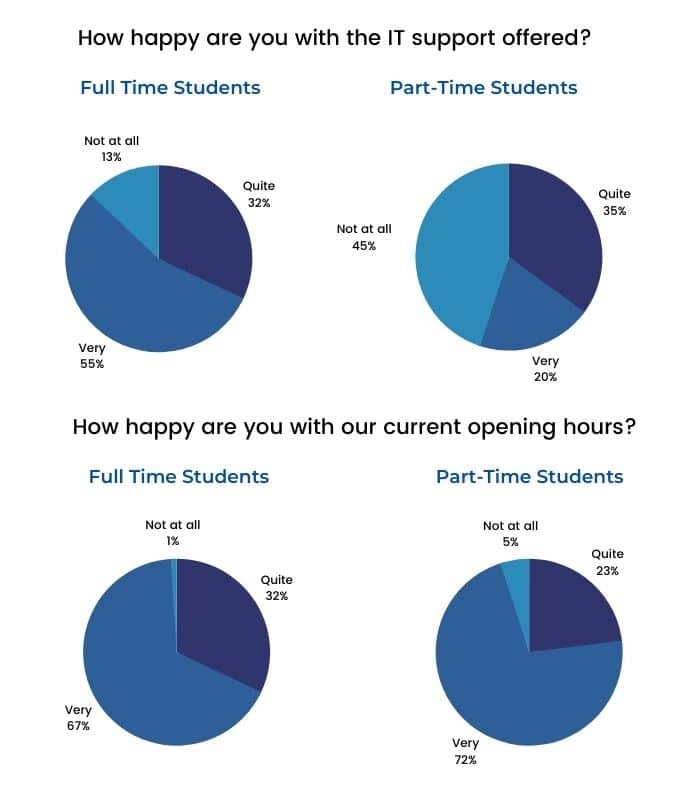
The charts below show the results of a survey conducted by a university library to find out the opinions of full-time and part-time students about its services.
 Summaries the information by selecting and reporting the main features, and make comparisons where relevant.
Write at least 150 words.
Real IELTS Exam Question, Reported On:
| India | 23rd April 2022 |
Practice with Expert IELTS Tutors Online
Apply Code "IELTSXPRESS20" To Get 20% off on IELTS Mock Test
Results of a Survey conducted by a University Library
Sample Answer 1
The pie charts compare the opinions of full-time and part-time students about their university services, including IT Support and library opening hours.
We can observe from the pie-charts that the full-time students tend to be more satisfied with the two services than their part-time counterparts. But, both full-time and part-time students gave positive feedback about the library opening hours.
Regarding IT Support, 55% of the total full-time students and only 20% part-time students were delighted. While 32% and 35% of the full-time and part-time students were quite happy with this service, 13% of the full-time students and 45% of the part-time counterparts were not satisfied at all.
In terms of opening hours, the majority of the full-time and part-time students were delighted. The former accounted for 67% while the latter made up to 72% respectively. Around 23% of the part-time students and 32% of the full-time counterparts were quite happy with these hours. Besides, the proportion of the students who were dissatisfied in both groups was significantly less, at 1% and 5%.
IELTS Writing Task 1 – Results of a Survey conducted by a University Library
The pie charts compare the opinions of full-time and part-time students about their university services, including IT support and opening hours.
Overall, it is clear that there was more positive feedback with regard to the opening hours than the IT support. Also, full-time students tended to be more satisfied with the two services than their part-time counterparts.
Regarding IT support, over half of the surveyed full-time students said that they were very happy with this service, while only a fifth of part-time students reported that they were very happy. In contrast, just 15% of the students studying full-time were not satisfied with IT support, in comparison with 45% of part-time students. The proportion of both types of students being quite happy with this service was relatively the same, at about one third.
The majority of full-time and part-time students felt very happy with the current opening hours, at 87% and 72% respectively. Only 1% of the examined full-time students were not satisfied with the opening hours whereas the figure for part-time students was a little higher, at 5%. The remaining 12% of the surveyed full-time students felt quite happy with this service, as opposed to nearly a quarter of part-time students.
Also Check: Education of Young People is Highly Prioritized Essay
