Consumer Spending Patterns IELTS Table
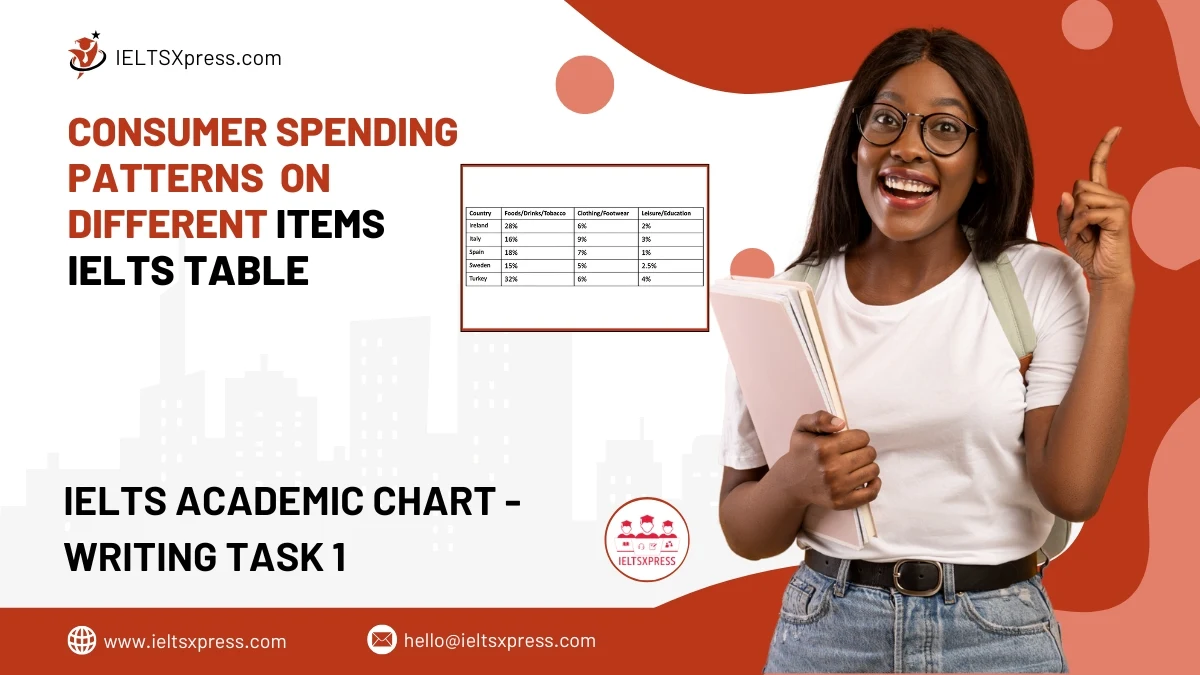
Analyze consumer spending patterns on different items in five countries in 2005 for IELTS Writing Task 1. Learn how to structure your response effectively.
Analyze consumer spending patterns on different items in five countries in 2005 for IELTS Writing Task 1. Learn how to structure your response effectively.
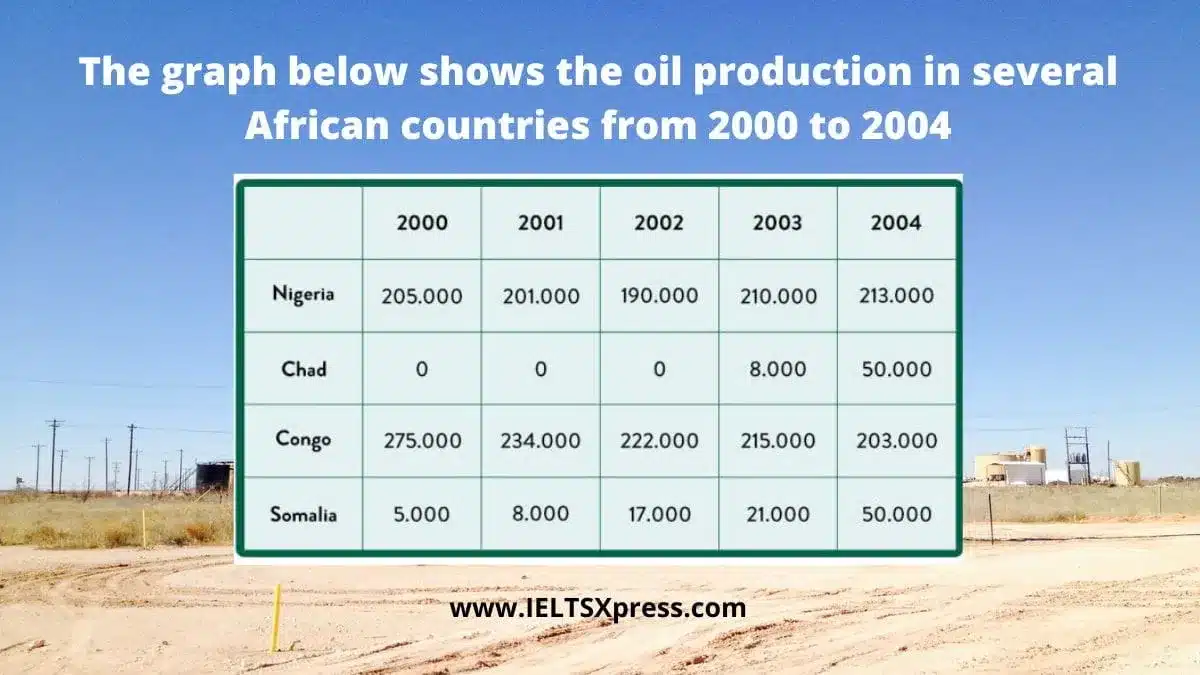
The graph below shows the oil production (in barrels) in several African countries from 2000 to 2004 IELTS Academic Writing Task 1.
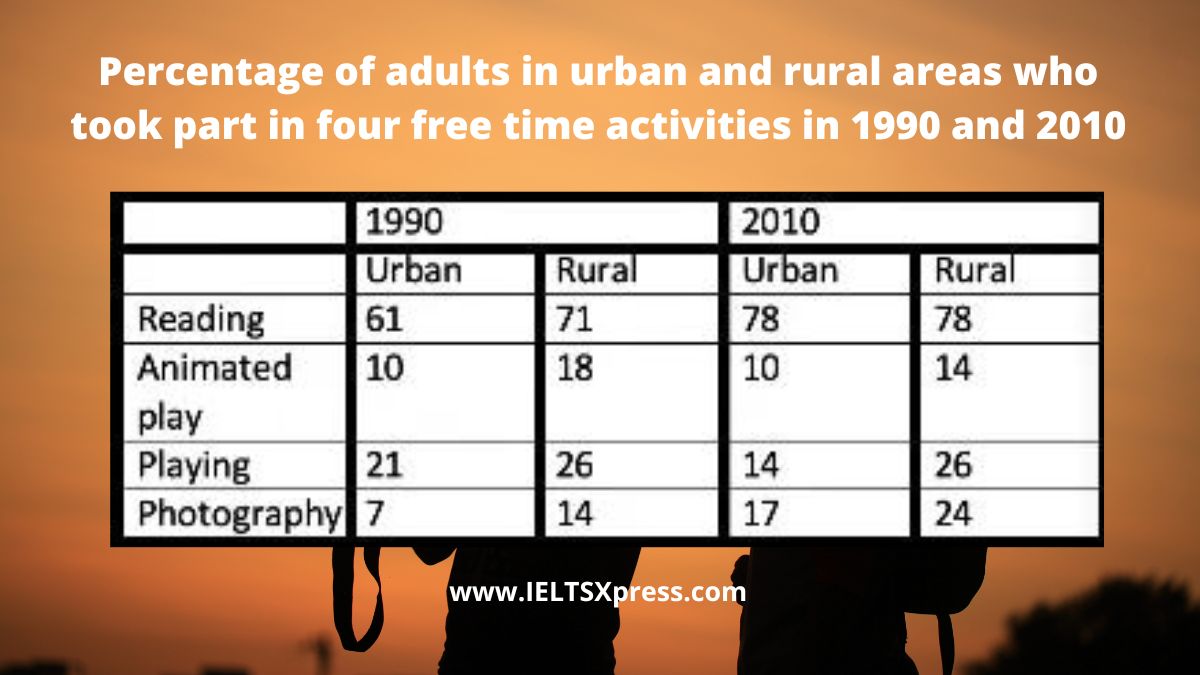
The table below shows the percentage of adults in urban and rural areas who took part in four free time activities in 1990 and 2010 IELTS Task 1.
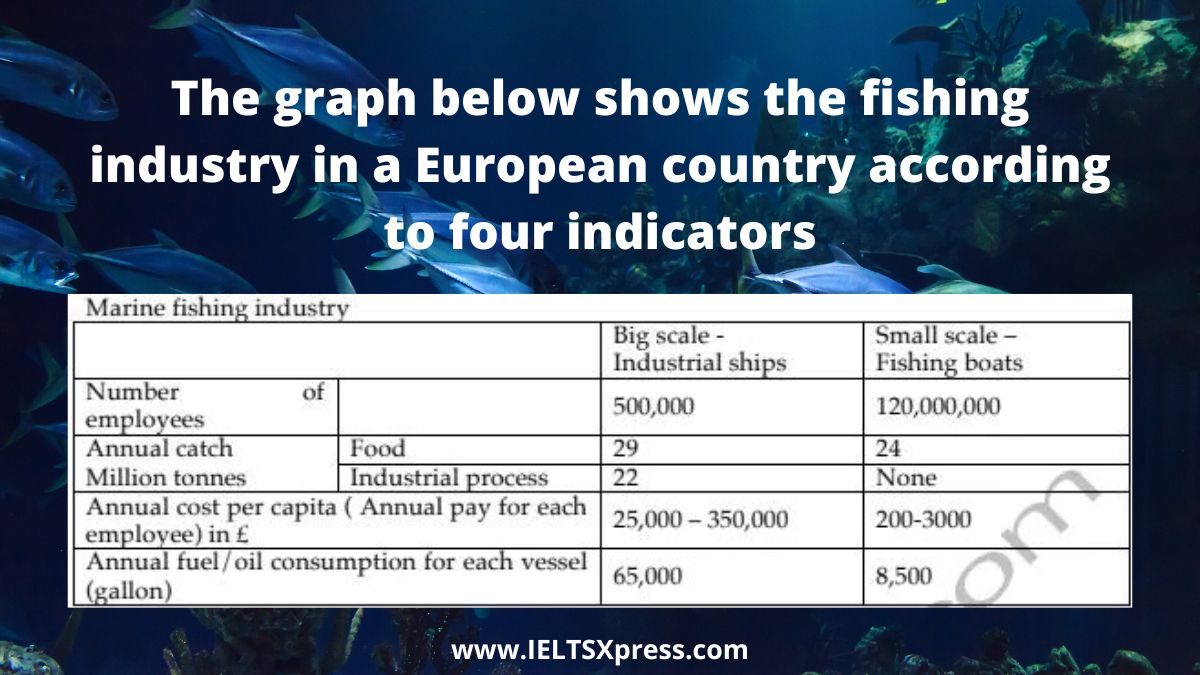
The graph below shows the fishing industry in a European country according to four indicators IELTS Academic Writing Task 1 Question.
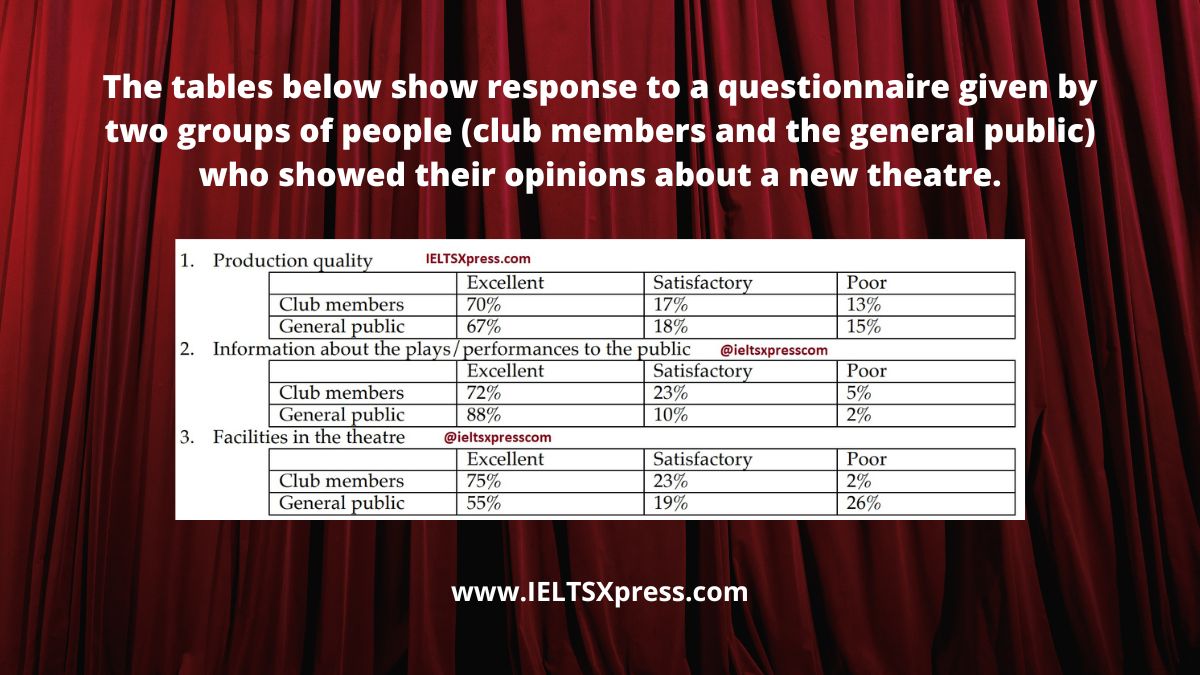
The tables below show response to a questionnaire given by two groups of people (club members and the general public) who showed their opinions about a new theatre.
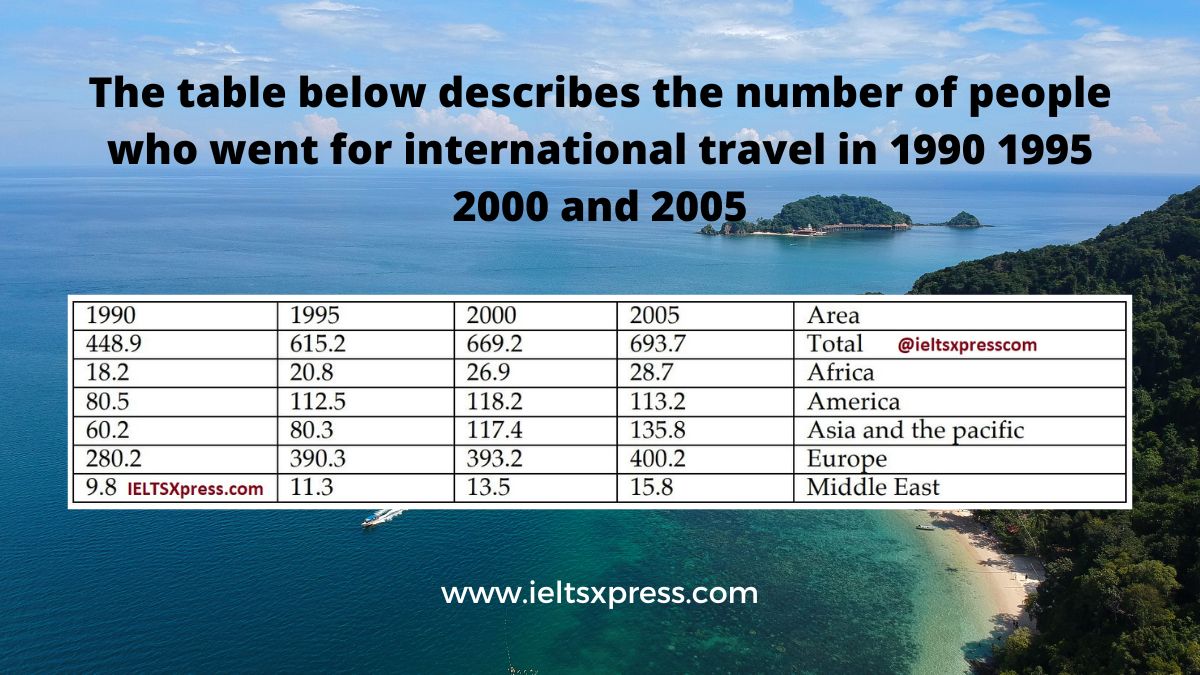
The table below describes the number of people who went for international travel in 1990 1995 2000 and 2005 (in million). IELTS Table Chart.
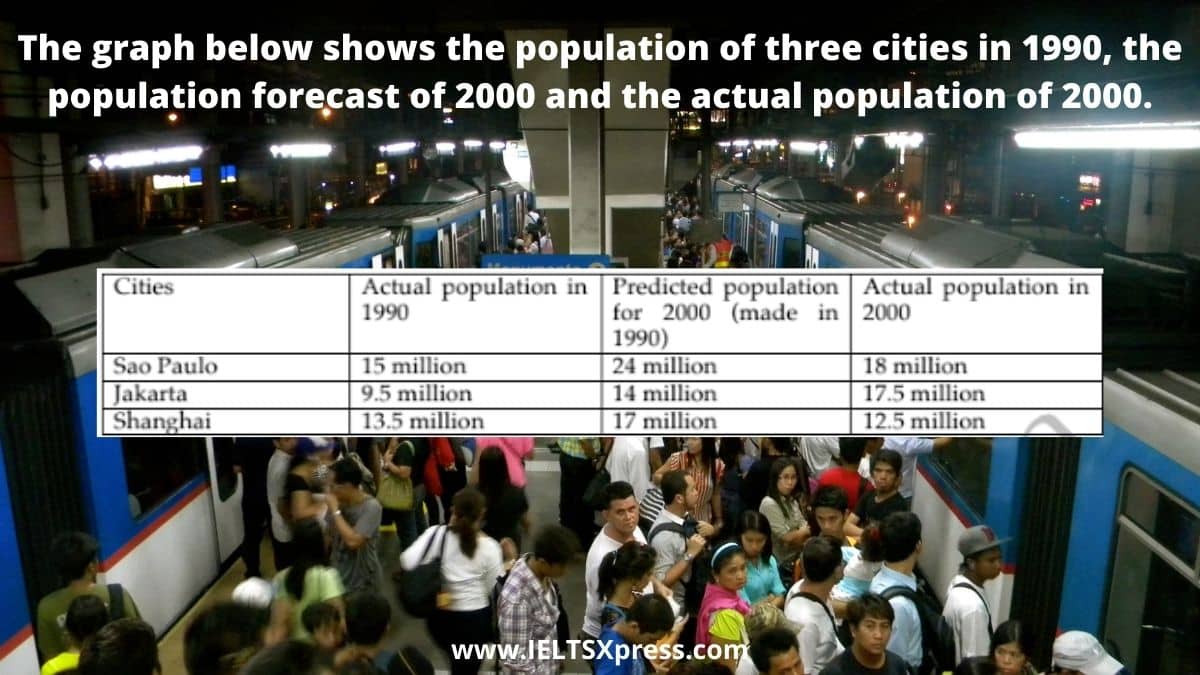
The graph below shows the population of three cities in 1990 the population forecast of 2000 and the actual population of 2000 IELTS Writing Task 1
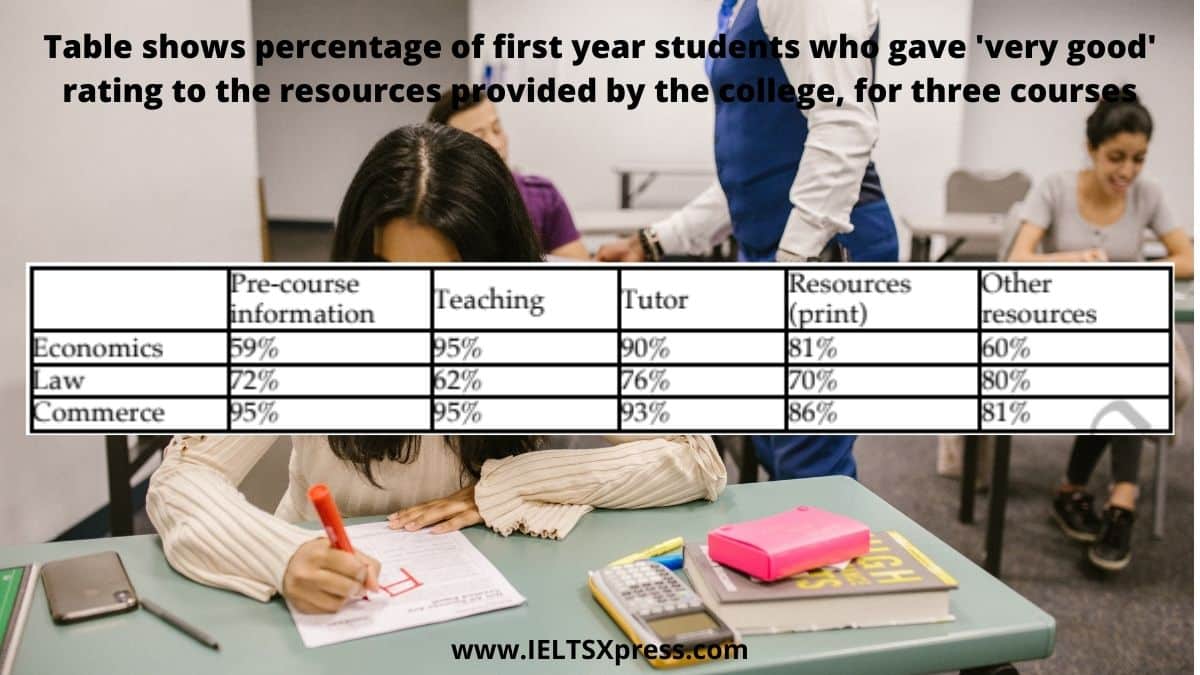
Table shows percentage of first year students who gave ‘very good’ rating to the resources provided by the college, for three courses. IELTS Task 1.

The table below illustrates how much money a single person and a couple in Australia need for a comfortable lifestyle after they retire.