The Percentage of Adults in Urban and Rural Areas Table
You should spend about 20 minutes on this task.
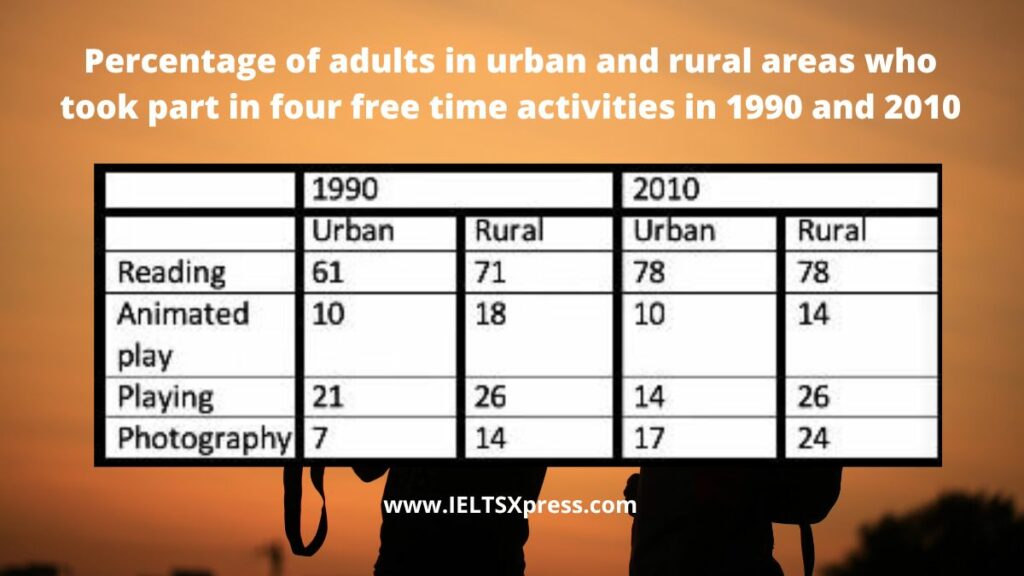
The table below shows the percentage of adults in urban and rural areas who took part in four free time activities in 1990 and 2010.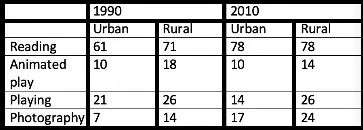
Summaries the information by selecting and reporting the main features, and make comparisons where relevant. Write at least 150 words.
Real IELTS Exam Question, Reported On:
Practice with Expert IELTS Tutors Online
Apply Code "IELTSXPRESS20" To Get 20% off on IELTS Mock Test
| India | 14th December 2024 |
| India | 26th November 2022 |
| India | 13th February 2020 |
The Percentage of Adults in Urban and Rural Areas IELTS Table
![]() The table presents the share of adults participating in different activities during their leisure time in urban and rural areas. It shows how much people spent their time reading, playing animated games, playing, and taking photographs in 1990 and 2010.
The table presents the share of adults participating in different activities during their leisure time in urban and rural areas. It shows how much people spent their time reading, playing animated games, playing, and taking photographs in 1990 and 2010.
Overall, people in urban areas increased proportionally more the amount of time they allocated to these activities between 1990 and 2010, narrowing the gap with rural areas. Whereas reading, animated plays, and photography became more popular over time, time spent playing fell in these 20 years. ieltsxpress
Regardless of the year, reading was the most popular activity performed both in urban and rural areas; more than 60% of people read during their free time. Furthermore, this percentage grew since 1990: 78% of people read in 2010, whereas 61% and 71% did so in 1990. Another activity whose popularity boosted over time is photography. Its percentage increased from 7% and 14% to 17% and 24% in urban and rural areas, respectively. In general, three out of the four activities became more popular over time. The exception is playing, which reduced the number of people doing it. ieltsxpress ![]()
Although percentages tended to grow in both areas, they did it even more in urban areas. Specifically reading and photography increased more in these last. As a result, the gaps between these two zones decreased over time.
The table below shows the percentage of adults in urban and rural areas
The tabular chart delineates the information about the percentum of adults who had participated in divergent leisure activities not only in cities but also countrysides from 1990 to 2010.
Overall, it is clearly evident that stability had been observed in the percentile of young individuals for doing reading in their recreational time in both small towns as well as mega cities.
![]() More specifically, it is identified that in 1990 , the maximum proportion of people gave preference to reading. However, playing animated series were the least liked by them. Equivalent (78%) of people did reading in their free time in both small towns and urban areas, whereas natives of rural areas were more fond of playing than cities’ people accounted for 26 with the difference of 5. ieltsxpress
More specifically, it is identified that in 1990 , the maximum proportion of people gave preference to reading. However, playing animated series were the least liked by them. Equivalent (78%) of people did reading in their free time in both small towns and urban areas, whereas natives of rural areas were more fond of playing than cities’ people accounted for 26 with the difference of 5. ieltsxpress
Further , no variations had been noticed in the proportion of youth who used to play in their free time recorded at 26.Nevertheless, there was a mammoth difference in the percentile of young blood who used to click photographs in 1990 in cities and villages which was 7 and 14.It escalated slowly for both of them in 2010 that was at 17 and 24 orderly. ![]()
Also Check: The Diagram shows How Orange Juice is Produced – Process
