You should spend about 20 minutes on this task.
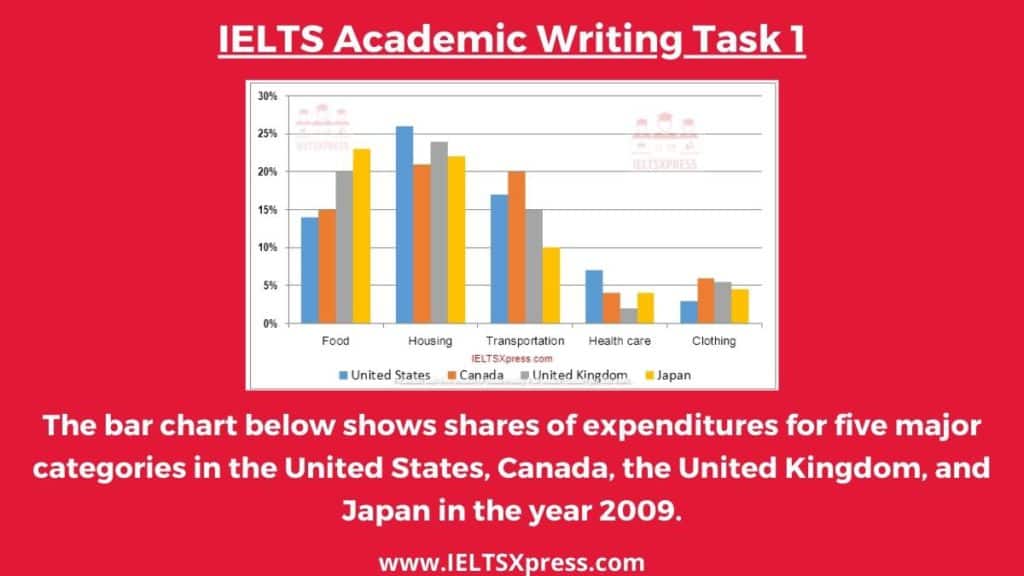
The bar chart below shows shares of expenditures for five major categories in the United States, Canada, the United Kingdom, and Japan in the year 2009.
Summarise the information by selecting and reporting the main features and make comparisons where relevant.
Write at least 150 words.
This chart was asked Recent IELTS Exam 30 December 2021 India Question Answers
IELTS Bar Chart – Expenditures for five major categories in the United States, Canada, the United Kingdom, and Japan in the year 2009
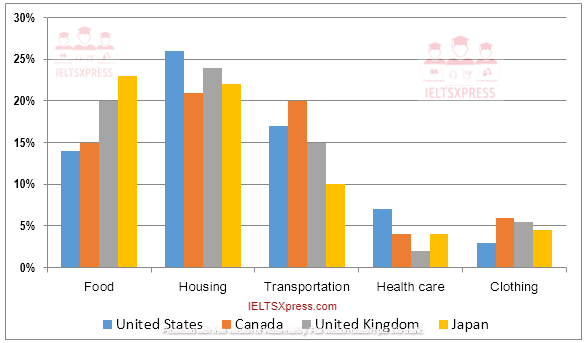
The given bar graph presents data on the expenses made by citizens of the US, Canada, UK, and Japan in five important categories in the year 2009. As is observed from the given illustration, housing costs were higher than any other categories, and healthcare and clothing received the least expenses by the people of these four given countries.
According to the given bar chart, most expenditure by the people of the given four countries was made in housing. In the United States, the proportion of expenses made in housing was highest (over 25%) among the given countries. In other countries, housing remained the most expensive category with over 20 percent of total expenses. The second most expensive category was food in Japan and in the UK with over 20% share of total expenditure. For the US and Canada Transportation was the second most expensive category while food was their third most expensive which cost around 17 to 20% of their total expenditure.
I E L T S X P R E S S
Healthcare and clothing were the least two expensive sectors. Only US people made more than 5% expenditure in healthcare while this was less than 5% in other three countries. Finally, clothing comprised just over 5% of total expenditure in Canada and in the UK while this was less than 5% in Japan and US.
The bar graph compares how much Americans, Canadians, English and Japanese spent on food, housing, transportation, health care and clothing in 2009. Generally speaking, housing and food cost more to these nationalities than other expenses this year.
As is given in the column graph, the Japanese spent around 23% money on food and this ratio was higher than that of other nationalities. UK residents’ spending on food was one-fifth of their total expenditure while it was less than 15% for the citizens of the USA and Canada. Housing on average drained the highest percentages of money and it was more expensive in the United States as more than one-fourth of their money went on arranging accommodation. All other nationalities had to spend between 20% – 24% on housing.
Transportation cost, on the other hand, was highest in Canada and one-fifth of spending by Canadians was for commuting. Japanese people spent the least on commuting and it was 10% of their expenses. Interestingly, these nationalities spent around 5% money on clothing which was slightly higher than that of their medical expenses. Us citizens had to spend the highest on health care which accounted for around 7% of their cost while it was the lowest in the UK.
The bar chart compares how consumers in the United States, Canada, the United Kingdom, and Japan allocated different shares of total spending to categories such as food, housing, and transportation in 2009.
We can see that the United States had the highest housing expenditure share, 26% of total expenditures in 2009. The United Kingdom and Japan followed, with 24% and 22%, respectively. Canada had the lowest housing share at 21%. Housing was the largest expenditure component in all countries except Japan.
Practice with Expert IELTS Tutors Online
Apply Code "IELTSXPRESS20" To Get 20% off on IELTS Mock Test
By contrast, Canada had the largest transportation share of all four countries at 20%. The United States and the United Kingdom had the next-highest transportation shares, 17% and 15%, respectively. Japan had the lowest, at 10%.
However, in Japan, consumers spent 23% of their total expenditures on food in 2009. The United Kingdom had the second-highest share at 20%. Canada, with 15%, and the United States, with 14% had the lowest food expenditure shares among the countries studied.
Overall, the data indicates that housing and health care shares of total expenditures were higher in the United States than in Canada, the United Kingdom, and Japan in 2009, whereas Americans had the lowest clothing share. Canada had the highest clothing and transportation shares, and Japan had the highest food share, among the countries compared.
Expenditures for five major categories – IELTS Bar Chart
The bar chart compares the percentages of consumers spending on five different items namely food, housing, transportation, health care and clothing in the United States, Canada, United Kingdom and Japan in 2009.
Overall, it is clear that consumers in these countries spent the most money on housing, food and transportation.
In 2009, the percentage of buyers in the United States spending on housing was highest, with 26%, compared to the lower figure for the British, with 24 %. The figures of Canadian and Japanese residents were almost the same, at 21 % and 22 % respectively. In contrast, 23% of Japanese citizens spent money on food, followed by 20% of the British, 14 % of Canadians and 13% of Americans. The proportions of the US
and Canada purchasers expending on transportation were higher than the figures for the others, with around 17 % and 20% respectively.
Healthcare and clothing were the least two expensive sectors. There were no significant differences in the proportions of the citizens in these nations spending on clothing, around 4 % to 6%. However, the rate of expenditure for health care in the United States was 7%, the figures for Canadian and Japanese citizens were the same, with 4%.
ieltsxpress
IELTS Bar Chart – Expenditure in the US, Canada, Japan and the UK
The bar chart compares the amount of money spent on different categories in five countries during the year 2009.
Overall, it is clear that housing and transportation were by far the most common expenditure in the five countries.
In terms of housing, the figure for the US was 26%, which was 2% higher than that of the UK and the percentage of Canada and Japan’s spending on this category were almost the same, at 22% and 24% respectively. In contrast, around 28% of Japan’s expenditure is used on food, followed by the UK with 20%, Canada with 15% and the US with 14%.
The amount of money spent on transportation in Canada was exactly 20%, doubling the figure for Japan (10%) and a little higher compared to the US (18%) and the UK (15%). However, there were no significant differences in the proportions of the outgoings in health care and clothing, with the approximate figures of 3-8 % and 4-7% respectively.
IELTS Writing Task 1 Bar Chart
The bar chart illustrates the consumer spending on five main items in four different countries in 2009.
It is clear that the largest proportion of consumer spending in all countries, except for Japan, went on housing. On the other hand, the health care and clothing categories provided the lowest figures in 2009.
As can be seen from the chart, the US expenditure on housing was highest, at about 26%, and Healthcare, at nearly 7%, and the same was true for Japan’s spending on Food with nearly 23%. Likewise, the proportion of spending on transportation was significantly higher in Canada, at about 20%, than in any of the other countries.
Out of the four nations, Canada had the lowest percentage of consumer expenditure on housing, at nearly 14%, whereas the Japanese spent the lowest amount of money on transportation, at around10%. However, US and UK had slightly higher figures for these categories, but the lowest figure for food, at nearly 14%. Additionally, the figures for clothing in all nations were relatively similar, hovering at 5%
Bar Chart Writing Task 1
The chart compares how consumers in four developed countries allocated different shares of total spending to five categories namely food, housing, transportation, health care and clothing in 2009.
Looking at the chart, it is immediately obvious that housing expenditure share registered the highest figure in all nations, with the exception of Japan. By contrast, in 2009, health care and clothing made up the smallest proportion.
Also Check: The Three Pie Charts below Show the Coffee Production and Consumption
In 2009, more than 25% of Americans’ expenses went to housing. The UK, Japan and Canada followed closely, with 24%, 22% and 21%, respectively. A somewhat similar allocation was seen on shares of healthcare, where the USA made up the biggest proportion of 8% and the UK had the smallest, 1%. By contrast, in the food category, the shares of expenditure in America registered approximately 14%, the lowest figure among 4 countries.
In Canada, consumers spent 20% of their total expenditures on transportation, making up the largest proportion. This figure was followed by America, the United Kingdom and Japan with 16%, 15% and 10%, respectively. Clothing’s shares of expense witnessed a similar allocation, where the proportions were 6%, 5%, 4% and 3%, respectively.
IELTS Academic Writing Task 1 – Bar Chart
The grouped bar chart compares the proportions of total spending that people in the US, the UK, Canada, and Japan spent on five key sectors, namely food, housing, transportation, health care, and clothing in 2009.
Overall, people from these four countries spent, on average, the most on housing, in contrast to health care, on which they spent the least. These categories represented about two-thirds of the total expenditures.
Americans had the highest relative housing costs of all four countries, over a quarter of their total expenditures in 2009. People in the other countries spent between 20 and 25 percent on accommodation. On the other hand, Japan had the highest relative food expenditure, approximately 23%. Transportation was the second highest expenditure in Canada at one-fifth, about 2% less than housing.
By contrast, the Japanese did not spend much on transportation, only 10%. Health care and clothing were the least expensive categories. Americans are the only ones who spent more than 5% on health care. Finally, clothing accounted for more than 5% of the total expenditure in the UK and Canada while this was less than 5% in America and Japan.
Academic Writing Task 1 Bar Chart
The bar graph compares the percentages of spending on different categories in the United States, Canada, the United Kingdom, and Japan in the year 2009. Overall, food, accommodation and transport accounted for the highest rates, while the figures for medical expenses and fashion were lower.
Looking at the three highest expenditures, Japanese people spent about 23% of their total spending on food, while this figure was 3% lower in the UK. In addition, food shares accounted for 15% in Canada and 14% in the United States. Regarding accommodation, the United States had the highest rate, at 26%, followed by 24% in the UK, 22% in Canada and 21% in Japan. In terms of transport, Canadians spent 20% of their total expenditure on this category, while the figures for the United States, the UK and Japan made up 18%, 15%, and 10%, respectively.
Turning to the other expenditures, medical expenses accounted for 7% in the United States, while Canada and Japan had approximately 4% each, followed by only 2% in Japan. In addition, Canadians spent about 6% of their total spending on fashion, while the figures for the other countries ranged from 4% to 5%.
Also Check: Bar Chart Band 7 Answer: Factors affecting Work Performance