IELTS Graph – Coffee Production, Coffee Consumption, and the Profit Distribution
Real IELTS Exam Question, Reported On:
| India | 15th April 2023 |
| India | 9th April 2022 |
You should spend about 20 minutes on this task.
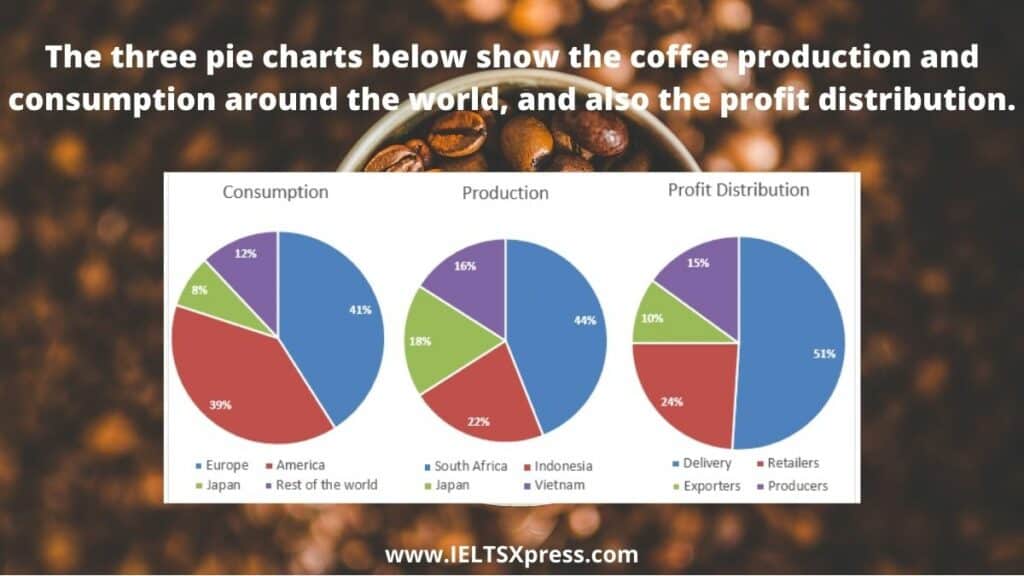
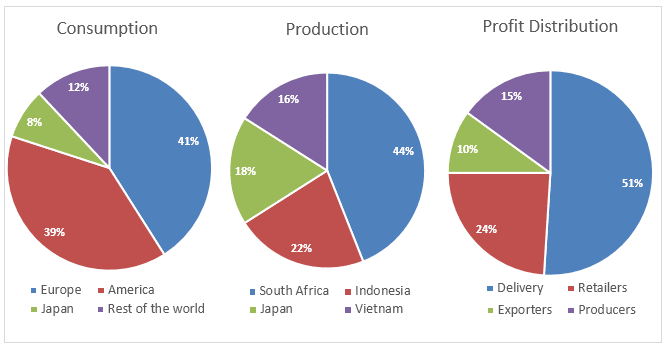
The three pie charts below show the coffee production and consumption around the world, and also the profit distribution.
Summarize the information by selecting and reporting the main features and make comparisons where relevant.
Write at least 150 words.
Three Pie Charts on Coffee
Sample Answer 1
The pie charts correlate global coffee consumptions, coffee production in four countries as well as profit distributions among business segments related to coffee. It is obvious that Europeans and Americans are the primary coffee consumers while South Africa is the largest coffee producer among the given countries. Moreover, companies that deliver coffee make more profit than other organisations that do business in this industry.
According to the illustration, Europeans drink more than 40% coffee which is the highest ratio of coffee intake in the world. America consumes 2% less than that while the Japanese dissipate only 8% of global coffee. The rest of the world merely consumes 12% coffee.
South Africa contributes to 44% coffee production which is the highest. Indonesia harvests 22% coffee, exactly half of the South African coffee assembly. Japan and Vietnam make 18% and 16% coffee respectively. Interestingly, despite Japan’s being one of the top countries to produce coffee, its consumption ratio is comparatively lower.
Finally, more than half of the profit from coffee is made by the delivery industries. Coffee retailers’ share of profit is roughly a quarter while coffee producers and exporters make 10% and 15% profits respectively.
Coffee Production and Consumption Pie Charts
Sample Answer 2
The three pie charts give information about global coffee production, consumption, and profit from numerous coffee-related businesses.
Overall, Europeans and Americans drink the highest amount of coffee while South Africa is the biggest producer. Additionally, the coffee delivery service is the most profitable business among those compared.
To begin with, citizens of Europe and America consume coffee four times as much as the rest of the world. Japan, whose production accounts for 18% internationally, only consumes a mere 8% of global coffee.
Practice with Expert IELTS Tutors Online
Apply Code "IELTSXPRESS20" To Get 20% off on IELTS Mock Test
It is worth noticing that South Africa produces 44% of the coffee (more than anywhere else), which is exactly double than the coffee production in Indonesia – the country that makes the second-largest coffee. Along with South Africa, Indonesia, and Japan, Vietnam also harvests coffee and the amount is 16%.
Regarding profit distribution, it can be seen that more than half of it goes to the coffee delivery industry. Retailers get approximately a quarter while the figure for coffee producers’ profit is only 15 percent. The remaining 10 percent is what exporters receive.
Coffee Production, Coffee Consumption, and the Profit Distribution
Sample Answer 3
The pie charts provide information about the worldwide consumption, production, and profit distribution of various sectors related to the coffee business.
All in all, Europeans are heavy consumers of coffee, followed by Americans. In contrast, South Africans are the largest coffee producers, with 44% of their contribution to the coffee industry. Notably, the companies that deliver coffee enjoy the most profit compared to the other business in this industry.
Based on these pie charts, coffee consumption in Europe is 41%, which is the highest in the world. Whereas the rest of the world consumes 12% coffee and Japanese coffee consumption is minimal at 8%. It can be because the consumption of tea is significantly higher than coffee in Japan.
But in the production sector, Japan contributes 18% of coffee production, and the contribution made by Indonesia and Vietnam is 22% and 16%, respectively. Whereas, South Africa’s contribution is highest with 44%. Finally, the profit from the coffee industry is enjoyed most by the delivery sector with 51%. While exporters only make 10% of the profit from the coffee industry.
Three Pie Charts IELTS Academic Writing Task 1
Sample Answer 4
The given pie charts illustrate the production and consumption of coffee, along with the proportion of the profits that are distributed. Regarding consumption and production, it is evident that Europe and South Africa lead the chart in the respective categories.
Europe consumes the highest amount of coffee at 41%, closely followed by America at 39%. 12% is indicated as the collective consumption of coffee in the rest of the world. Coffee production is the highest in South Africa, 44% to be exact, however, the other three countries listed are quite far behind. The second most coffee producing country is Indonesia, but it has half of that of South Africa’s production. Japan is the third coffee producing country at 18%, surprisingly, as it is shown to be consuming the least amount of coffee at 8%. Vietnam is the last among all coffee producing countries with 16 % production.
Half of the total profit of the coffee market is distributed among delivery resources – 51%. A quarter of the profit is earned by the retailers, leaving producers with 15% of the yielding. The least amount of profit – 10% – eventually goes to the exporters.
Also Check: Mixed Chart – The changes in the UK industry steel between 1970 and 2000