How much Money a Single Person and a Couple in Australia need – IELTS Table Chart
Real IELTS Exam Question, Reported On:
Practice with Expert IELTS Tutors Online
Apply Code "IELTSXPRESS20" To Get 20% off on IELTS Mock Test
| India | 11th February 2023 |
| India | 20th January 2022 |
You should spend about 20 minutes on this task.
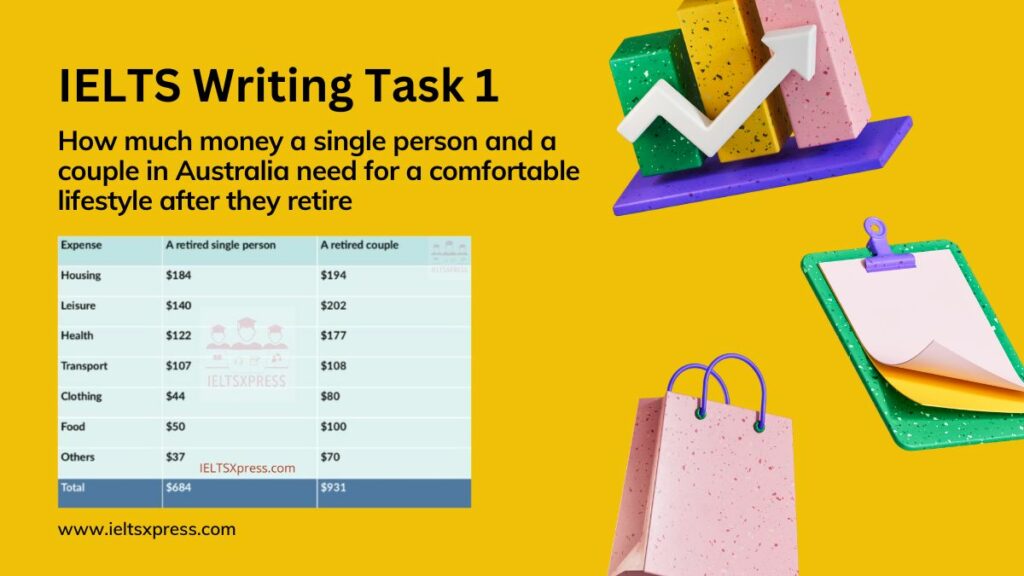
The table below illustrates how much money a single person and a couple in Australia need for a comfortable lifestyle after they retire.
Summarise the information by selecting and reporting the main features and make comparisons where relevant. Write at least 150 words.
The Table below illustrates How much Money a Single Person and a Couple in Australia need
Sample Answer 1
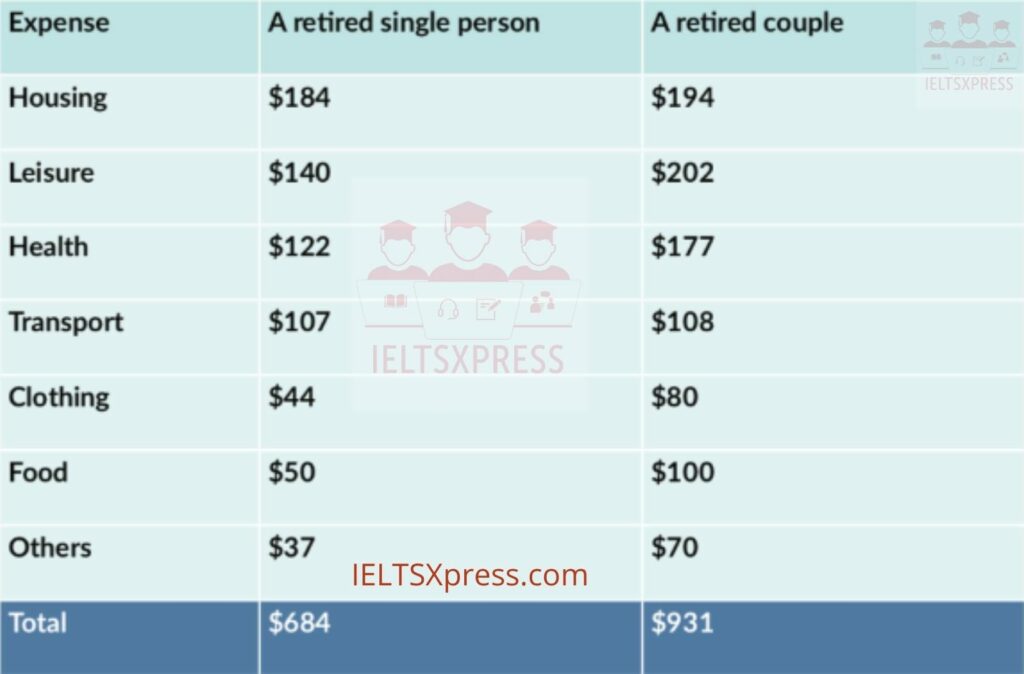
The table compares the budgets needed for retired singles and couples to live a comfortable lifestyle in Australia.
Overall, the average budget of a retired single person is much lower than that of a couple. In addition, while housing is the biggest expenditure for single retirees, retired couples need more money for leisure activities.
The expenditure for housing of retired single people is $184, which is $10 lower than that of couples. Meanwhile, singles retirees spend $140 on leisure activities, while couples spend $60 more. Regarding healthcare, couples spend $177, which is $50 higher than the expenditure of a single retired person.
In terms of transport, couples and singles need roughly the same amount of money, at $108 and $107 respectively. When it comes to clothing, food, and other things, the figure for an individual is almost half that of a couple. A single person spends $44, $50 and $37 respectively on these categories, while a couple spends $80, $100 and $70. In general, the total amount of money spent by an individual is $684, whereas the figure for a couple is $931.
In contrast, the majority of people participating in the survey expected to see improvements in the communication between people, at 64%, while only 36% of them thought the opposite. Meanwhile, opinions on food quality were divided almost equally with just over half the survey participants believing that things would improve, and 49% thinking the opposite.
How much Money a Single Person and a Couple in Australia need for a comfortable Lifestyle
Sample Answer 2
The yielded table illustrates how much money retired single and couple person spends per week in Australia, expenses measured in dollars.
Overall, it can be clearly seen that others and housing expenses are most in both categories while shopping on the least. In addition, the retired couple per week expenses total is more than a single person who retired. ieltsxpress
For a retired single person, per week, use the average of 650 dollars. Housing expenses are $160 whereas, with the highest $177 spend on other. Above both expenses contain a roughly half proportion of total usage. Spending on clothing is double than shopping expenses. Furthermore, food, shelter, and health expenses are $55, $92, and $64, respectively.
For 2 retired persons, total weekly spending is nearly$300 more than one retired person. Roughly expenses on food and health are similar on account of $70. $120 is used on clothing whereas same amount more money spending on housing-related than single retired persons. Moreover, Spending money on shelter is $110, which is half than shopping usage. Other expenses have 223 dollar expenses.
IELTS Academic Writing Task 1 Table Chart
Sample Answer 3
The table compares the budgets needed for retired singles and couples to live a comfortable lifestyle in Australia.
Overall, the average budget of a retired single person is much lower than that of a couple. In addition, while housing is the biggest expenditure for single retirees, retired couples need more money for leisure activities.
The expenditure for housing of retired single people is $184, which is $10 lower than that of couples. Meanwhile, singles retirees spend $140 on leisure activities, while couples spend $60 more. Regarding healthcare, couples spend $177, which is $50 higher than the expenditure of a single retired person. ieltsxpress
In terms of transport, couples and singles need roughly the same amount of money, at $108 and $107 respectively. When it comes to clothing, food, and other things, the figure for an individual is almost half that of a couple. A single person spends $44, $50 and $37 respectively on these categories, while a couple spends $80, $100 and $70. In general, the total amount of money spent by an individual is $684, whereas the figure for a couple is $931.
In contrast, the majority of people participating in the survey expected to see improvements in the communication between people, at 64%, while only 36% of them thought the opposite. Meanwhile, opinions on food quality were divided almost equally with just over half the survey participants believing that things would improve, and 49% thinking the opposite.
Also Check: Global Population Trends Line Chart – IELTS Writing Task 1


