British Emigration to Selected Destination Bar Chart
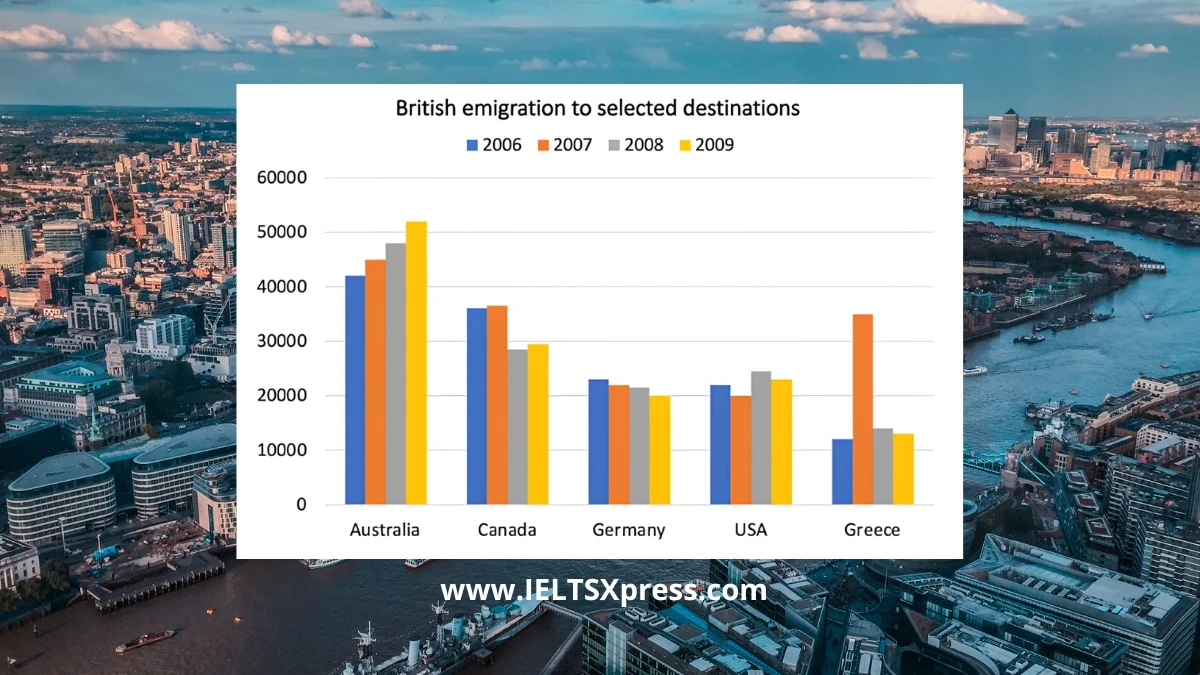
Analyze the IELTS bar chart on British emigration to selected destinations between 2006 and 2009 with key trends and insights.
Analyze the IELTS bar chart on British emigration to selected destinations between 2006 and 2009 with key trends and insights.
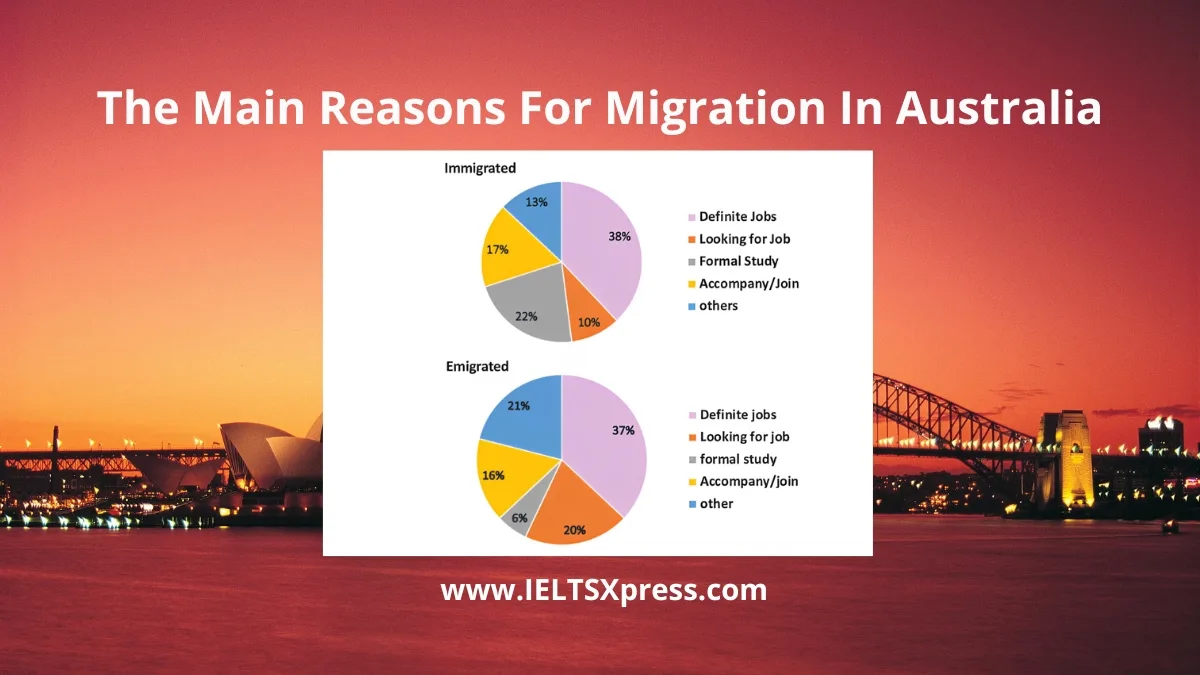
Discover key insights from The Pie Charts Show The Main Reasons For Migration In Australia. Learn how to describe data for Academic Writing Task 1.

Discover key insights from a pie chart showing the native languages spoken by students. Learn how to describe data for Academic Writing Task 1.
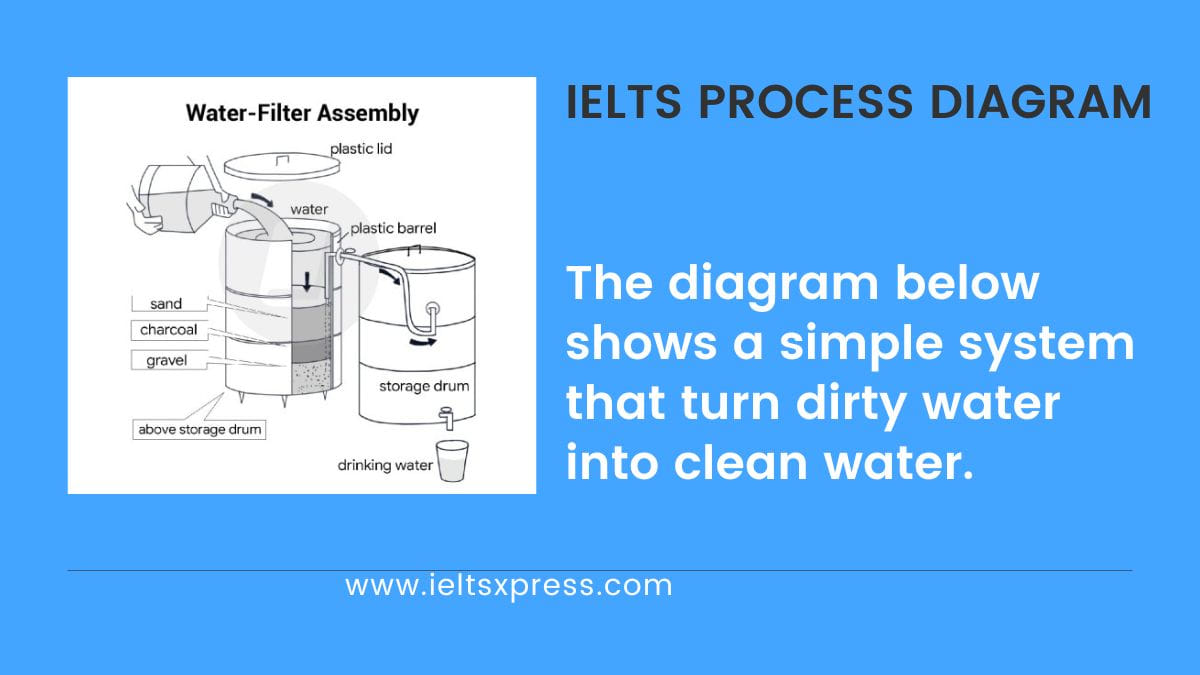
The diagram below shows a simple system that turn dirty water into clean water. IELTS academic writing task 1 Process Diagram.
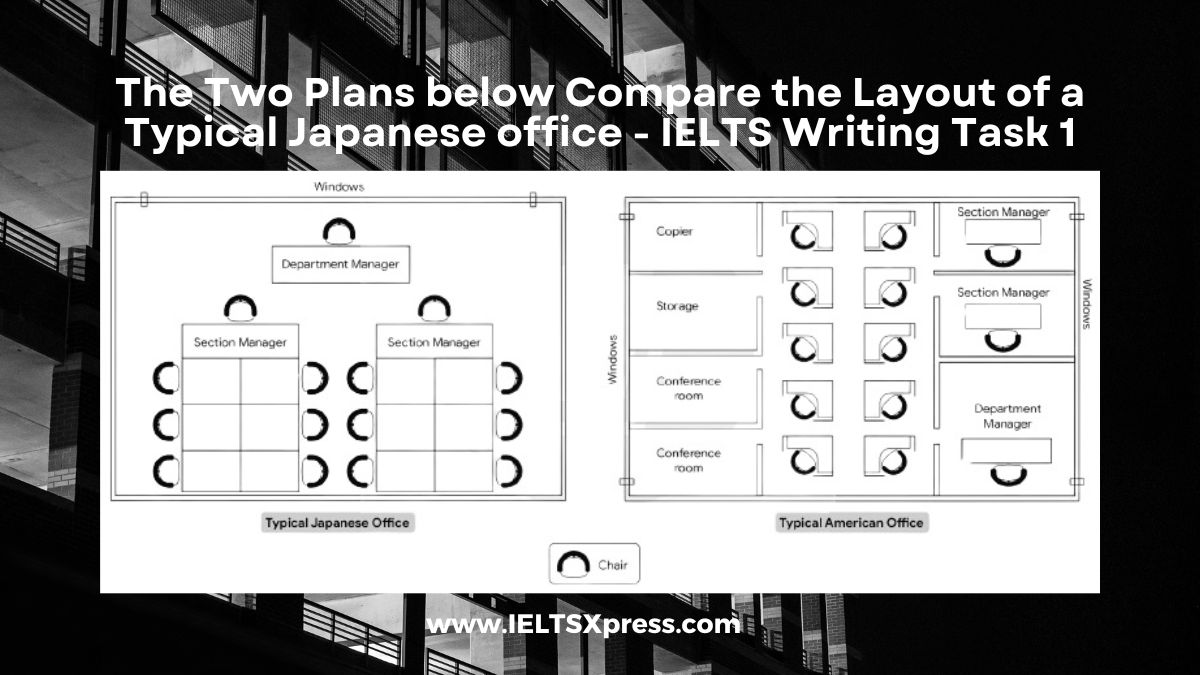
The Two Plans below Compare the Layout of a Typical Japanese Office and a Typical American Office IELTS Academic Writing Task 1.

The Diagrams Show the Structure of Solar Panel and its Use IELTS academic writing task 1 Process Diagram with sample model answers.

Are you preparing for the IELTS Academic test and aiming to achieve a high score in Task 1 of the Writing section? If so, you’re in the right place.
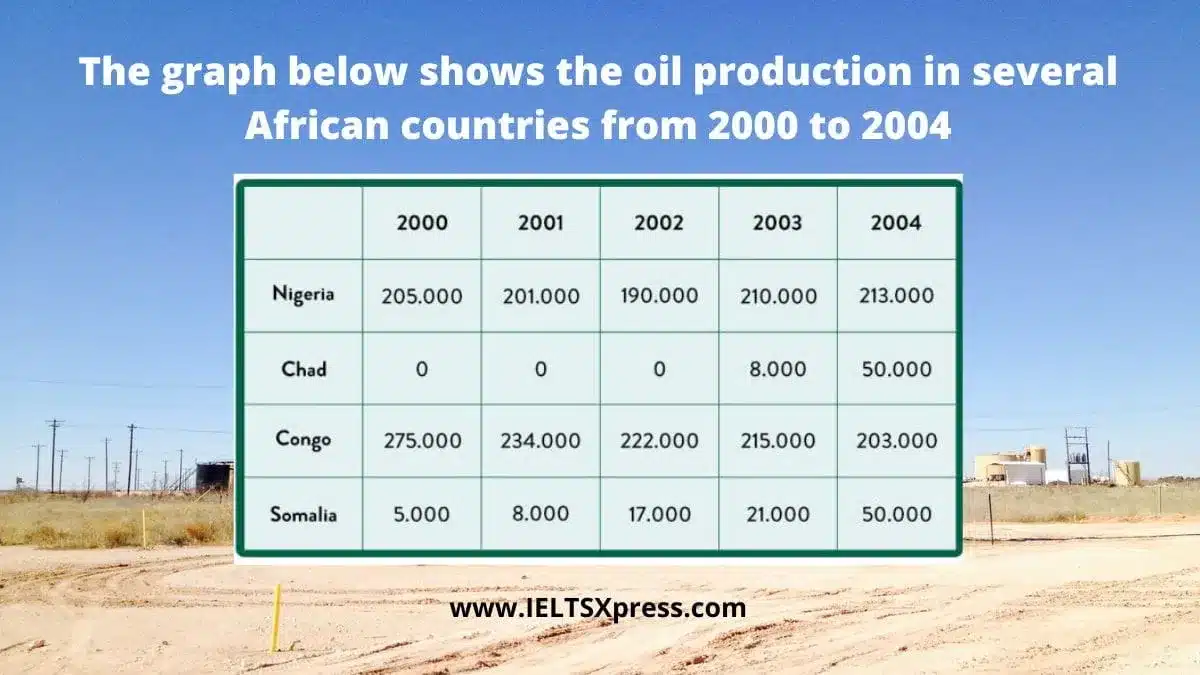
The graph below shows the oil production (in barrels) in several African countries from 2000 to 2004 IELTS Academic Writing Task 1.
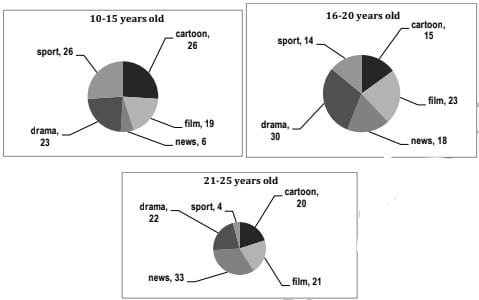
The graphs below show the viewership of different TV programmes among three different age groups IELTS Academic Writing Task 1 Pie Chart.
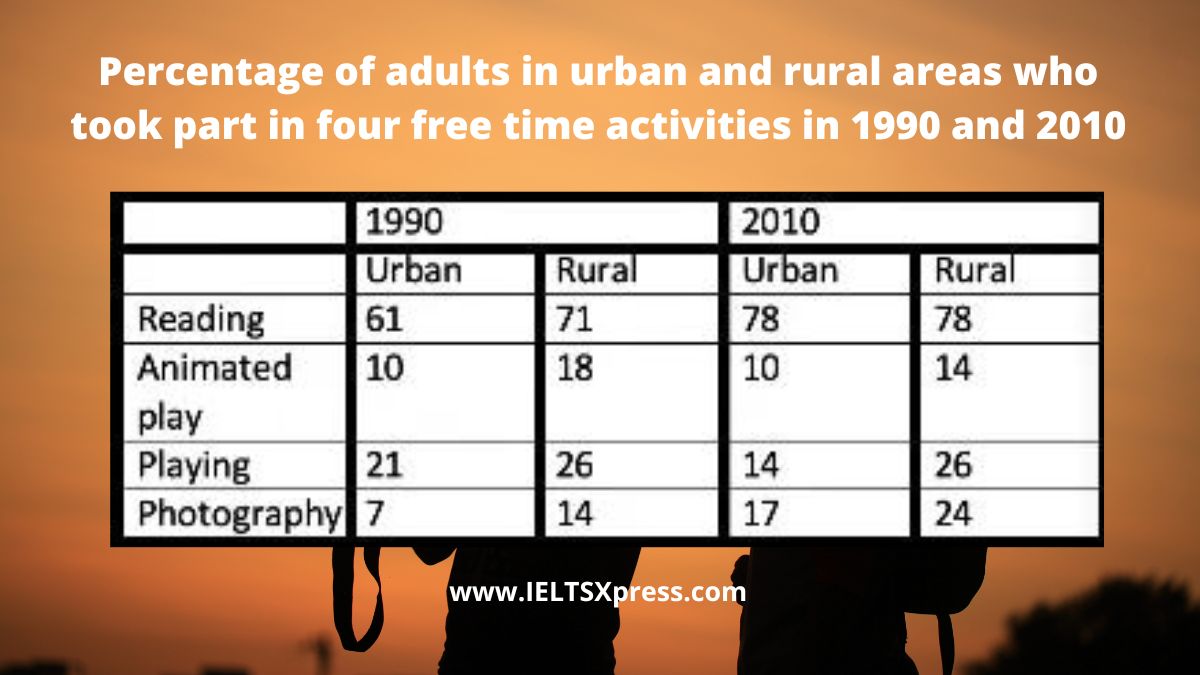
The table below shows the percentage of adults in urban and rural areas who took part in four free time activities in 1990 and 2010 IELTS Task 1.
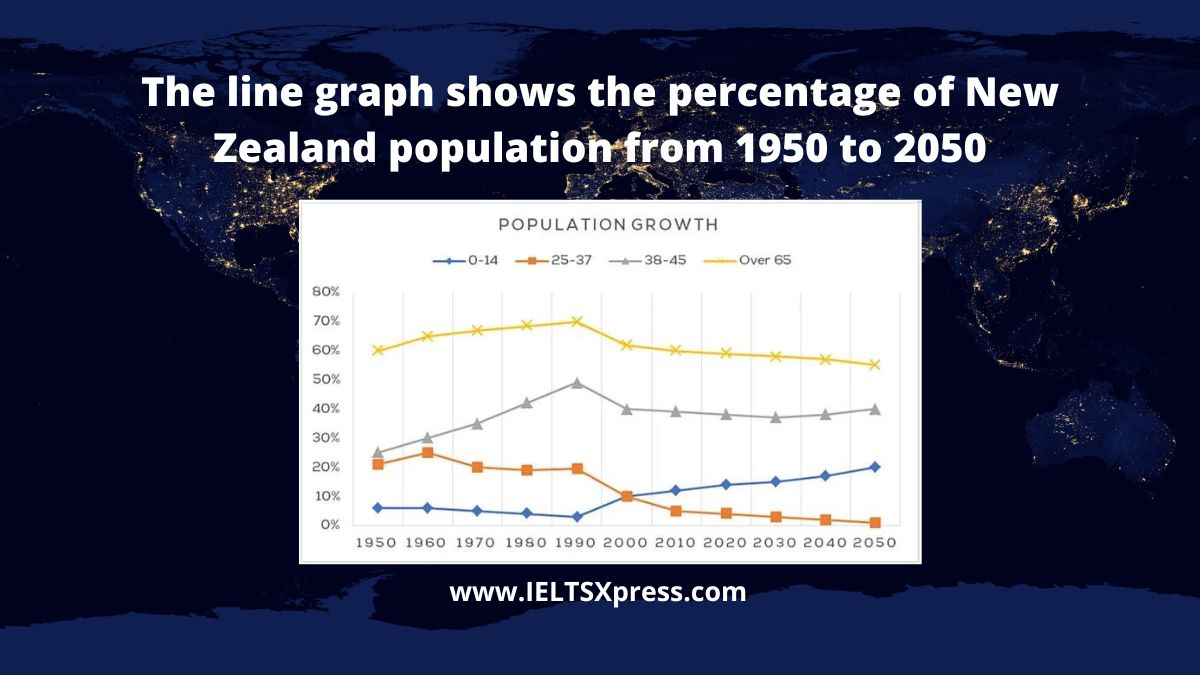
The line graph shows the percentage of New Zealand population from 1950 to 2050 IELTS Academic Writing Task 1 Line Chart.
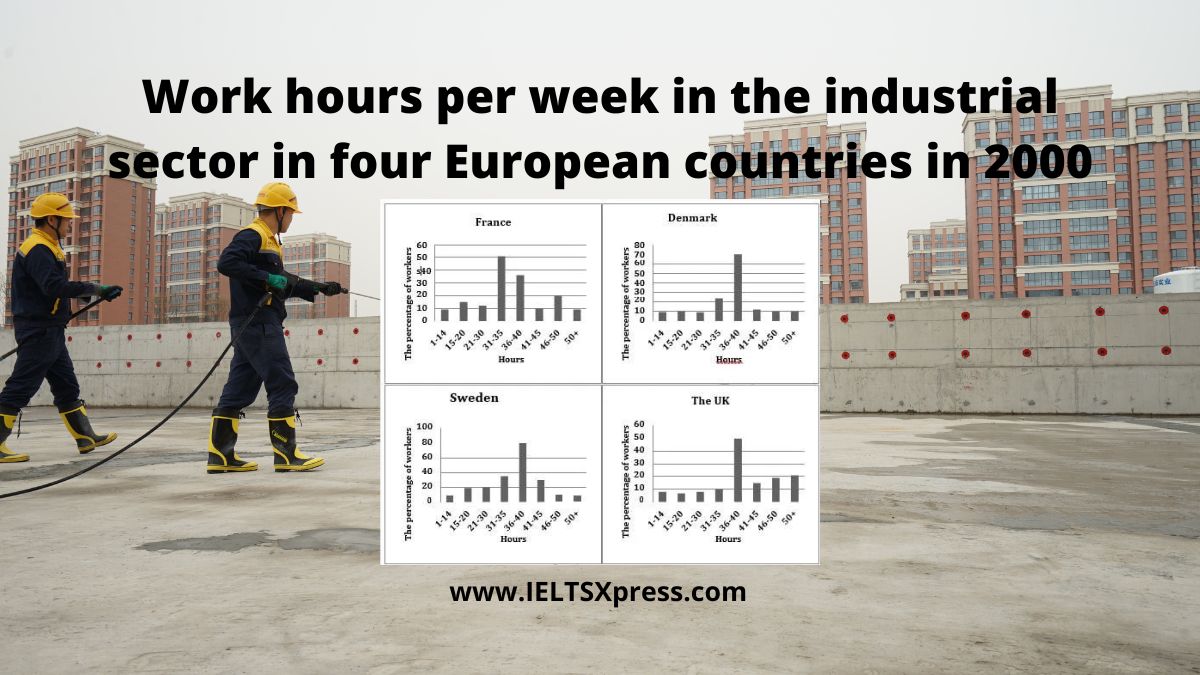
The charts below show the figure for work hours per week in the industrial sector in four European countries in 2002 IELTS Writing Task 1.
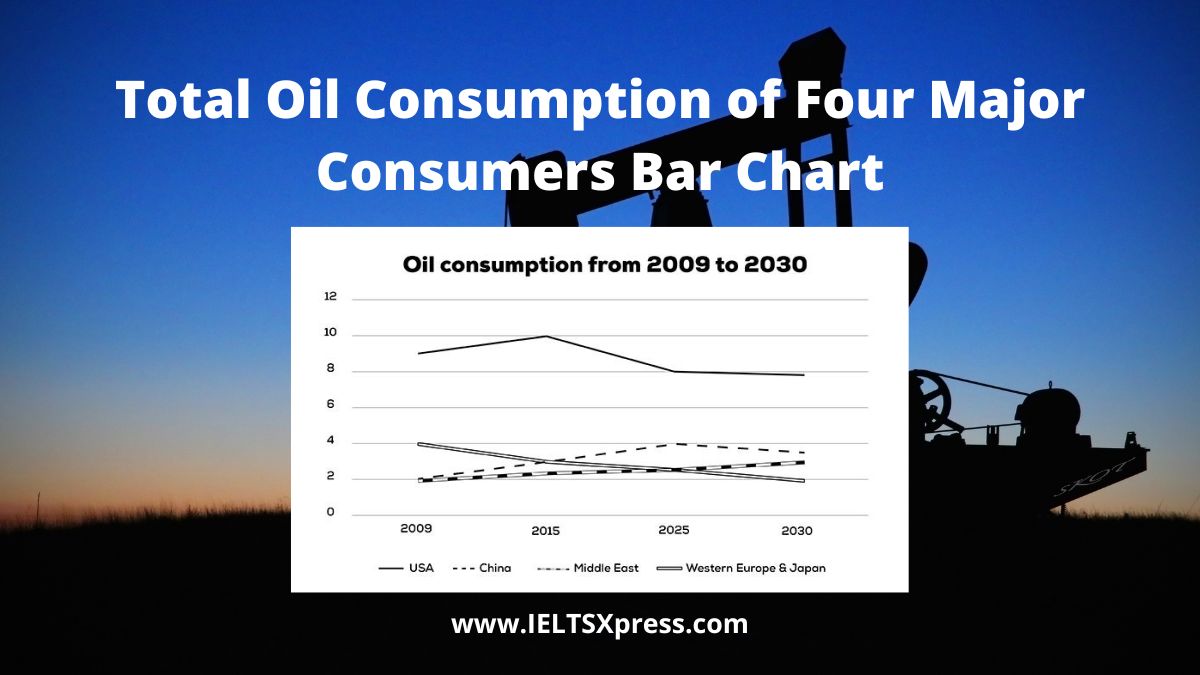
The graph below shows information about the total oil consumption of four major consumers from 2009 to 2030 IELTS Academic line chart.
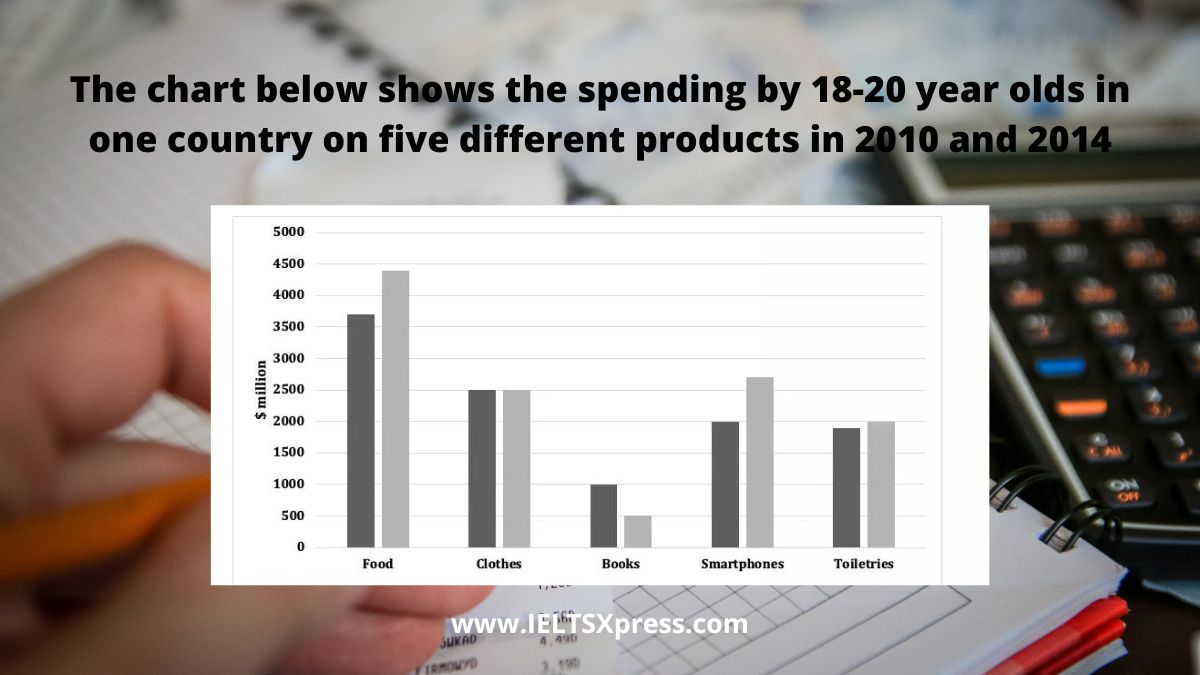
The chart below shows the spending in million by 18-20 year olds in one country on five different products in 2010 and 2014 IELTS Writing Task 1.
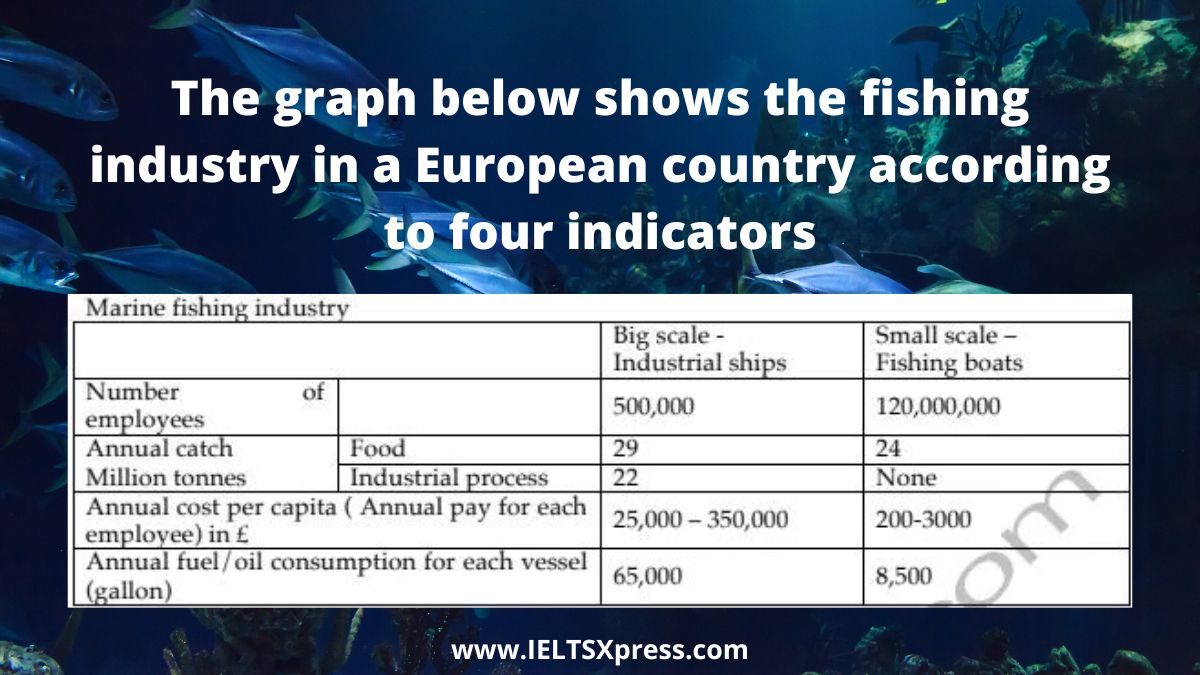
The graph below shows the fishing industry in a European country according to four indicators IELTS Academic Writing Task 1 Question.