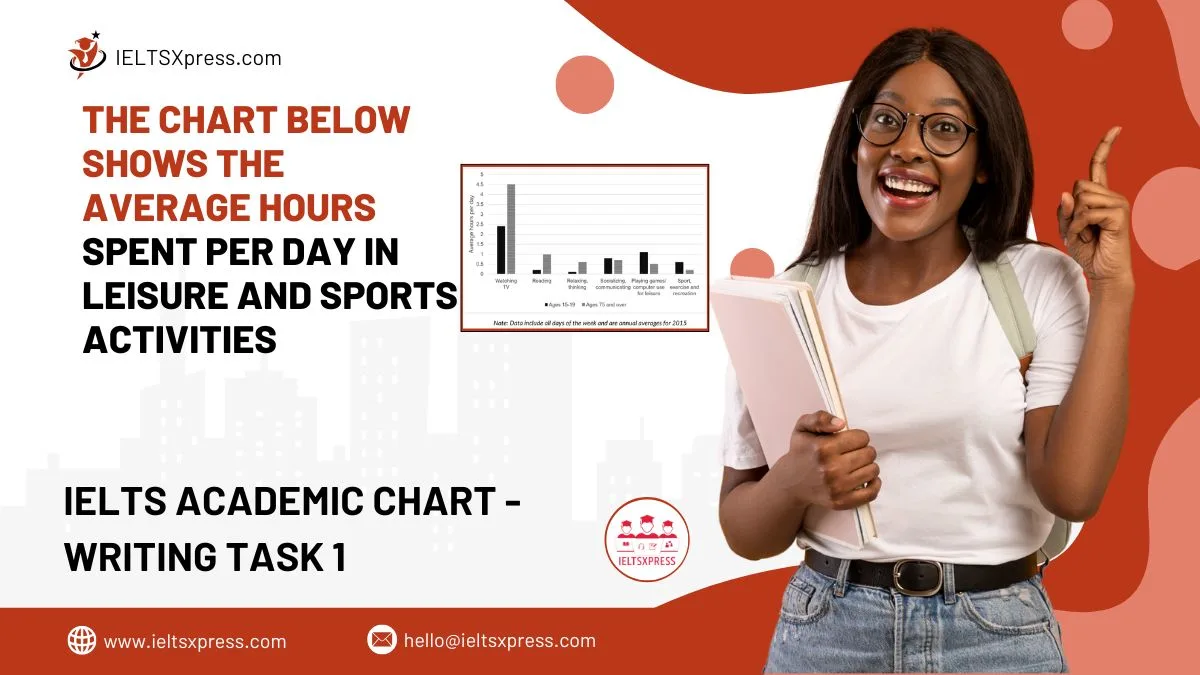
The Chart Below Shows the Average Hours Spent Per Day in Leisure and Sports Activities
The Chart Below Shows the Average Hours Spent Per Day in Leisure and Sports Activities – analysis by age and gender based on daily time use data.
The Chart Below Shows the Average Hours Spent Per Day in Leisure and Sports Activities – analysis by age and gender based on daily time use data.

Learn how to describe the IELTS bar chart on fruit production by weight for 1995, 2005, and 2015 with sample answers, tips, and key points for a high band score.
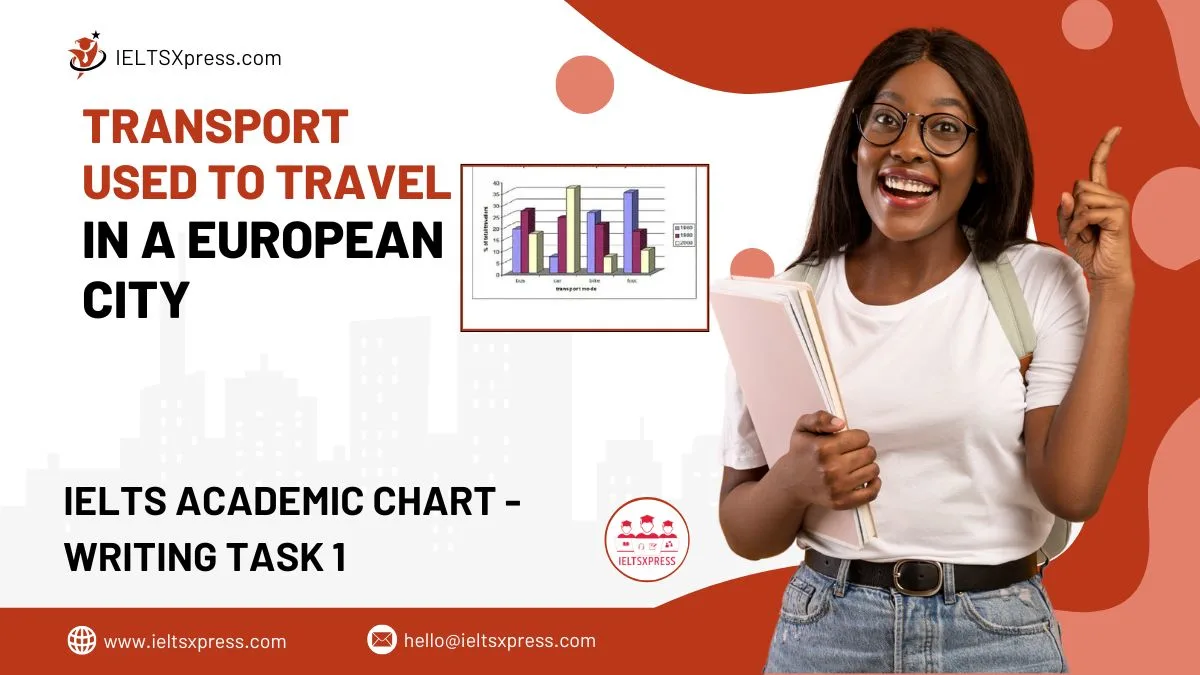
Analyze IELTS Writing Task 1 bar chart Transport used to travel in a European city. Learn structure, vocabulary, and tips to write a high-band response.
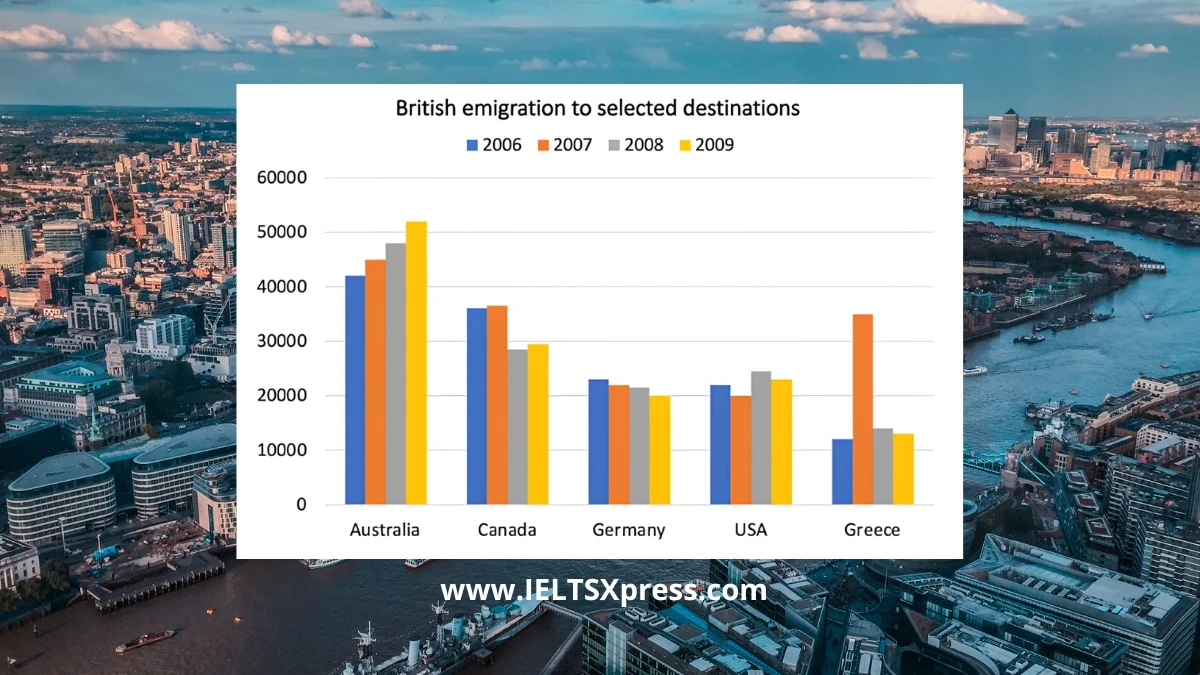
Analyze the IELTS bar chart on British emigration to selected destinations between 2006 and 2009 with key trends and insights.
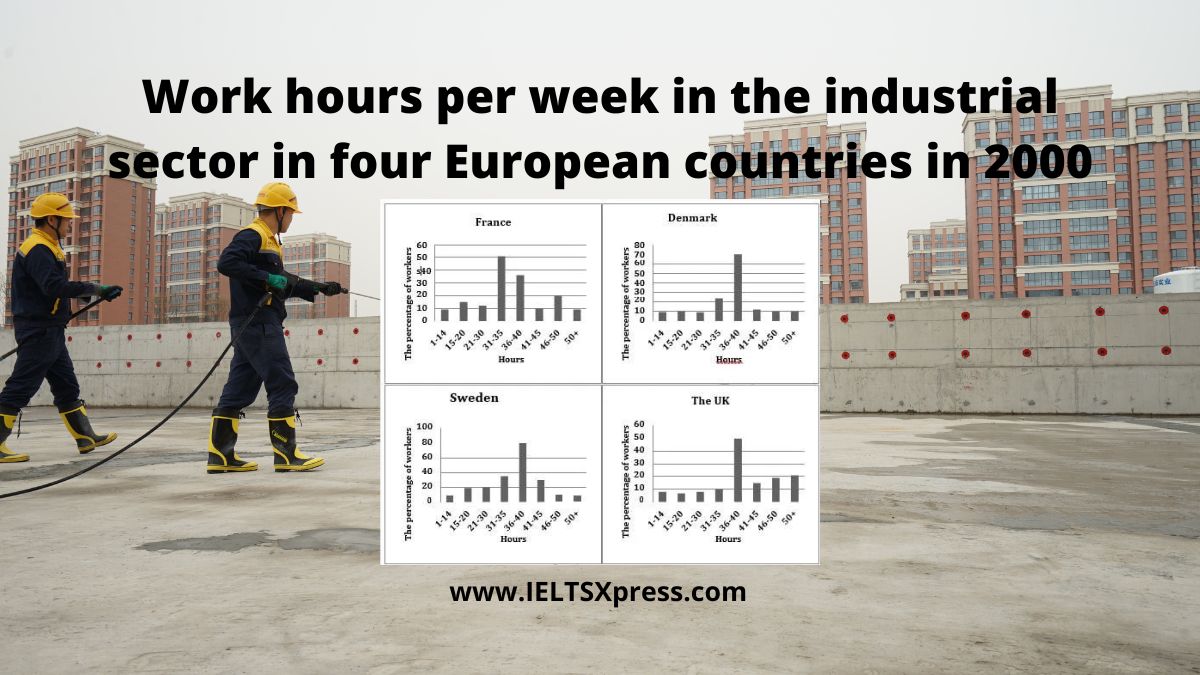
The charts below show the figure for work hours per week in the industrial sector in four European countries in 2002 IELTS Writing Task 1.
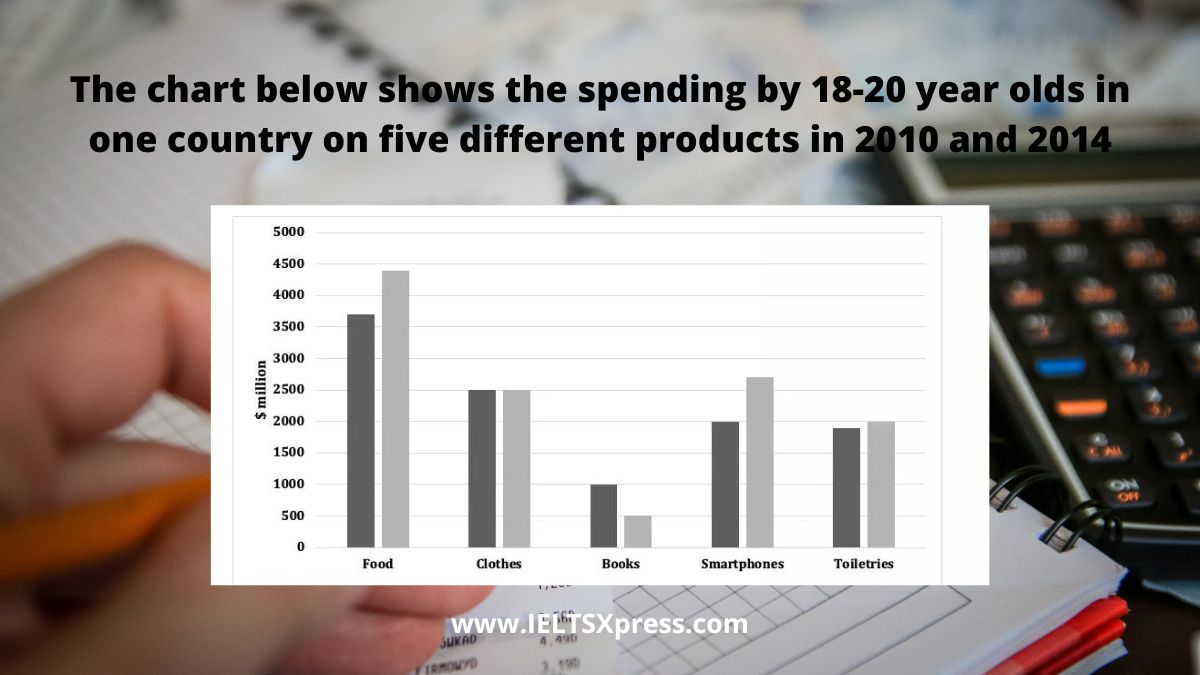
The chart below shows the spending in million by 18-20 year olds in one country on five different products in 2010 and 2014 IELTS Writing Task 1.

The chart shows the employment status of adults in the US in 2003 and 2013. IELTS Academic Writing Task 1 Bar Chart with sample answers.
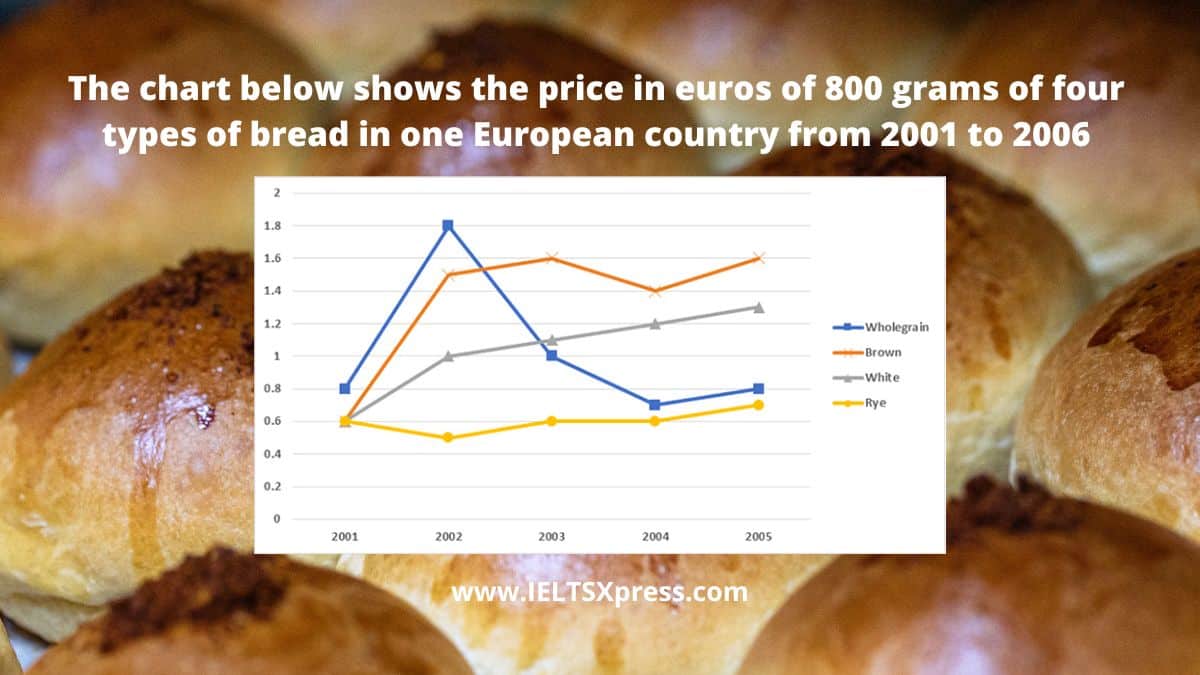
The chart below shows the price in euros of 800 grams of four types of bread in one European country from 2001 to 2006 IELTS Academic Bar chart
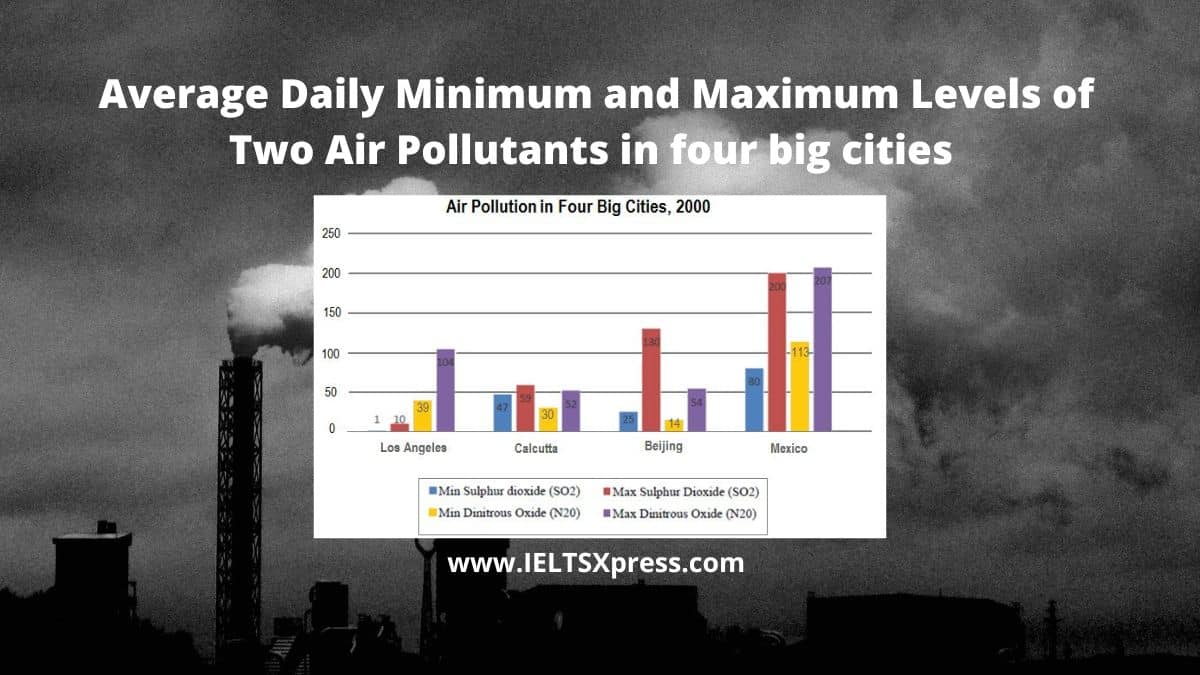
The chart below shows the average daily minimum and maximum levels of two air pollutants in four big cities in 2000 IELTS Academic Bar Chart.

The graph below shows the participation of Australian children in sports outside school hours in 2014. IELTS Academic Writing Task 1 Bar Chart.
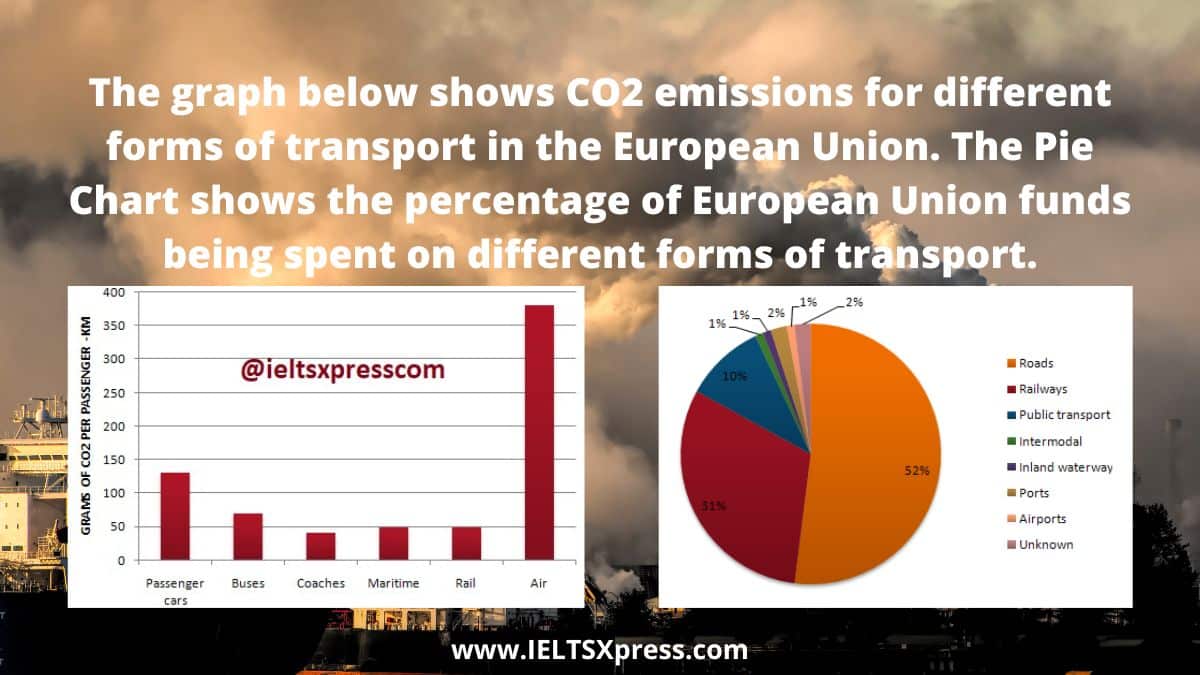
The graph below shows CO2 emissions for different forms of transport in the European Union. The Pie Chart shows the percentage of European Union funds being spent on different forms of transport.
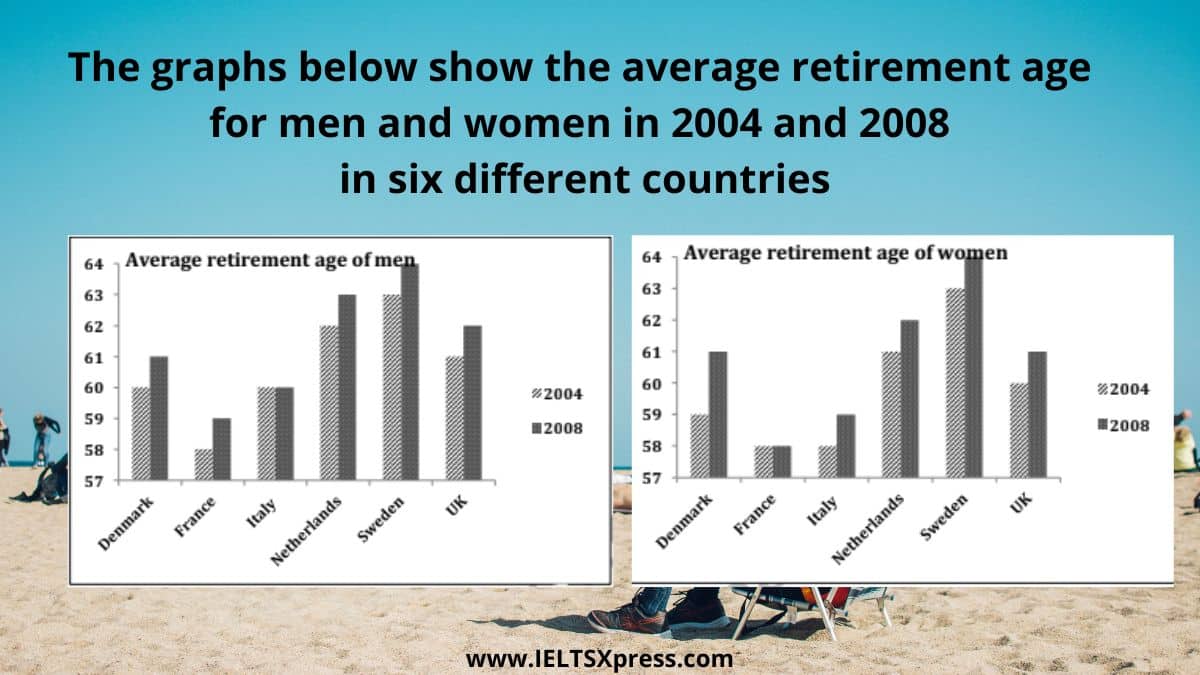
IELTS Writing Task 1 Bar Chart. The graphs below show the average retirement age for men and women in 2004 and 2008 in six different countries
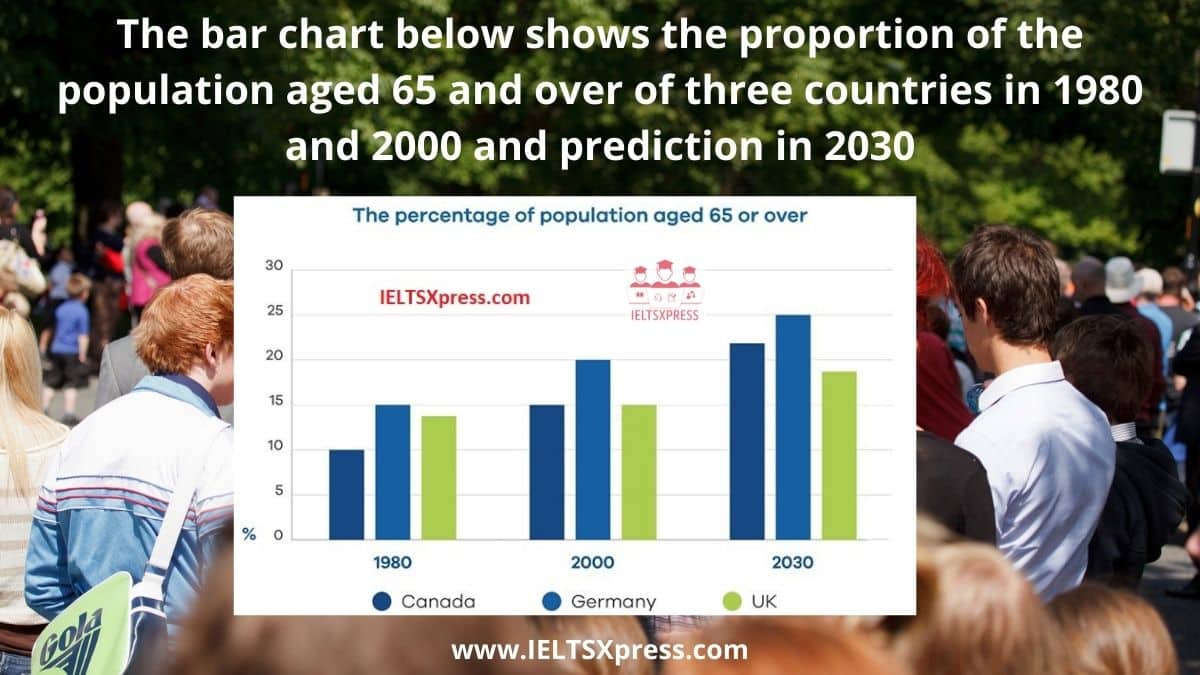
The bar chart below shows the proportion of the population aged 65 and over of three countries in 1980 and 2000 and prediction in 2030 ielts task 1
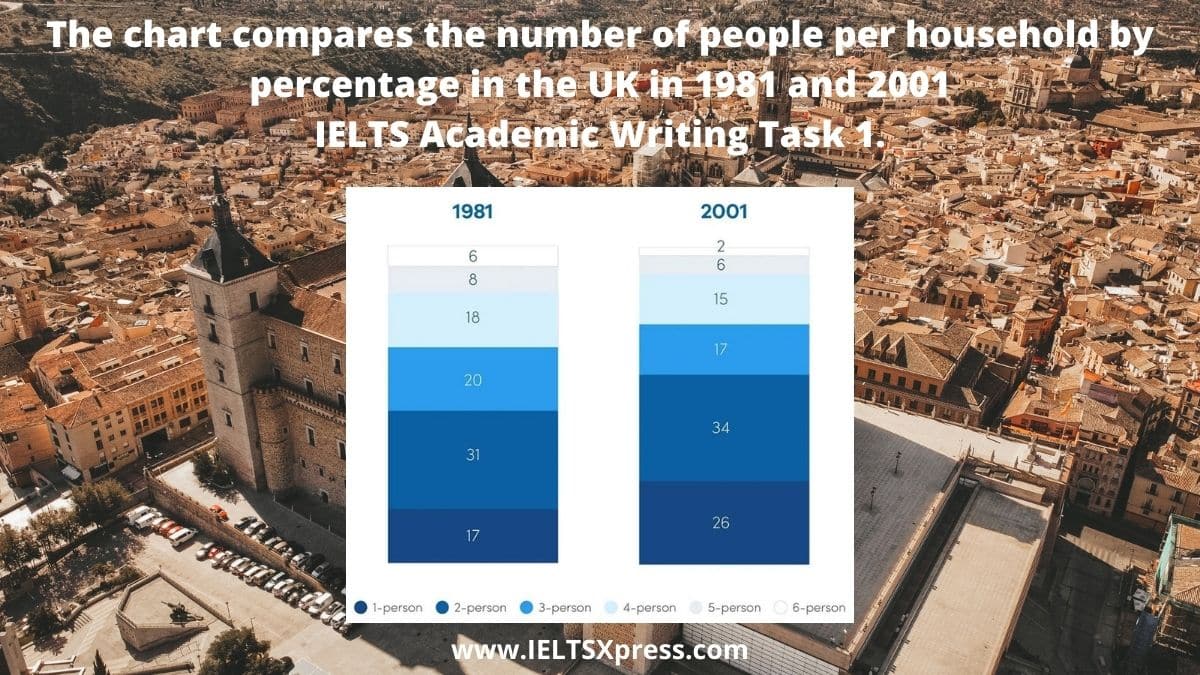
The chart compares the number of people per household by percentage in the UK in 1981 and 2001 IELTS Academic Writing Task 1.

The chart below shows the global sales of different kinds of digital games from 2000 to 2006. IELTS Writing Task 1 Bar Chart Sample Answers.