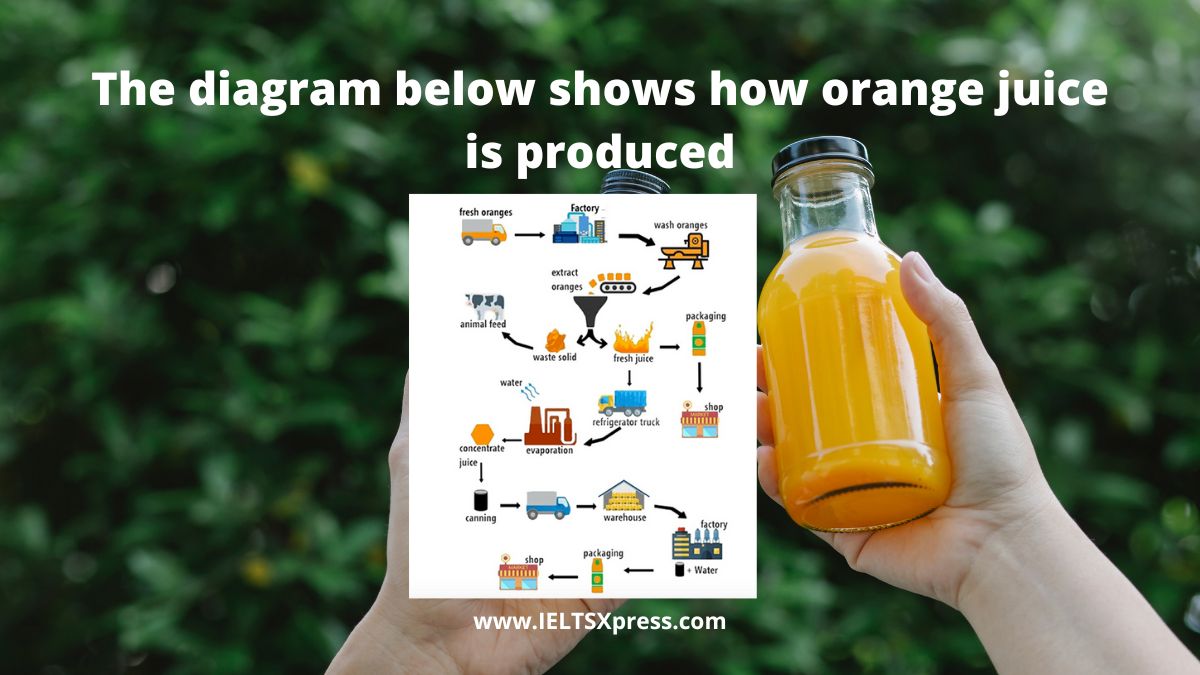
The Diagram shows How Orange Juice is Produced – Process
The diagram shows how orange juice is produced IELTS academic writing task 1 Process Diagram with sample model answers.
The diagram shows how orange juice is produced IELTS academic writing task 1 Process Diagram with sample model answers.
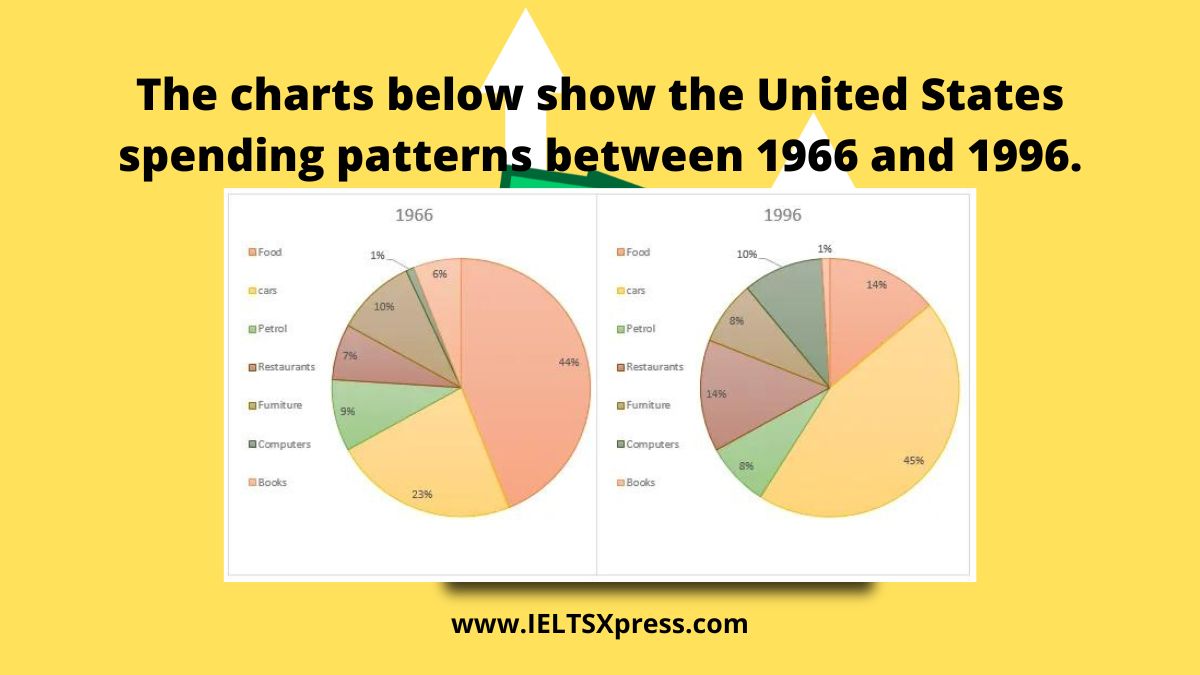
The charts below show the United States spending patterns between 1966 and 1996. IELTS Academic Writing Task 1 Pie Chart with sample answer.

The chart shows the employment status of adults in the US in 2003 and 2013. IELTS Academic Writing Task 1 Bar Chart with sample answers.
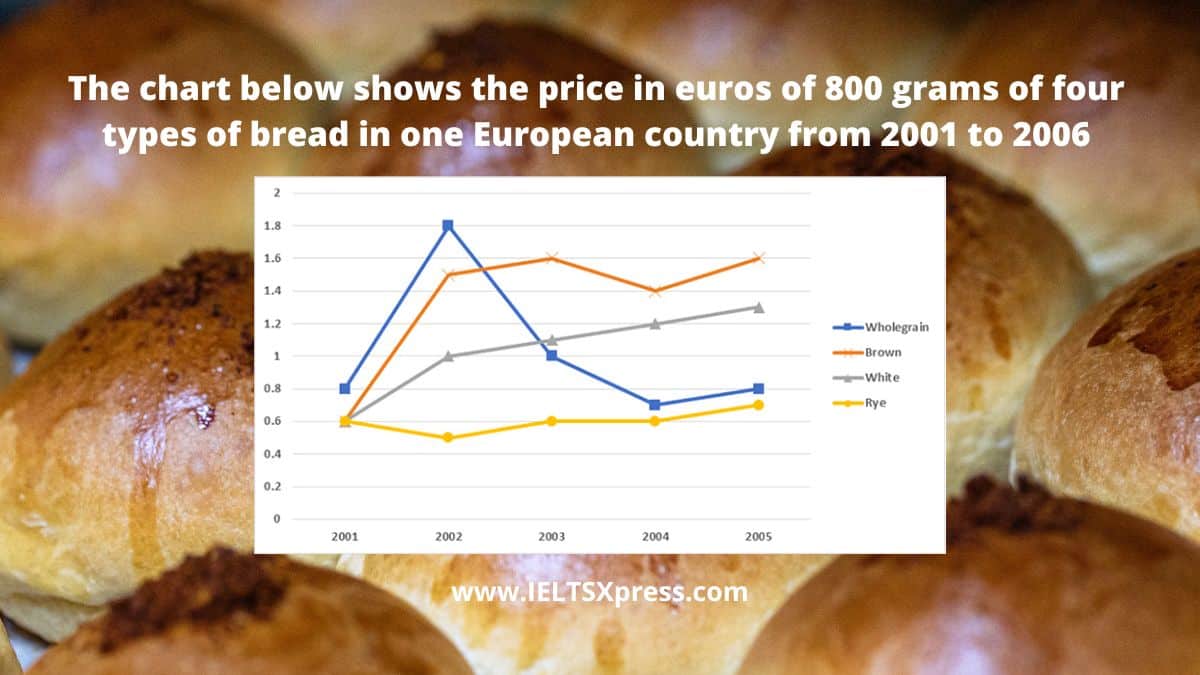
The chart below shows the price in euros of 800 grams of four types of bread in one European country from 2001 to 2006 IELTS Academic Bar chart
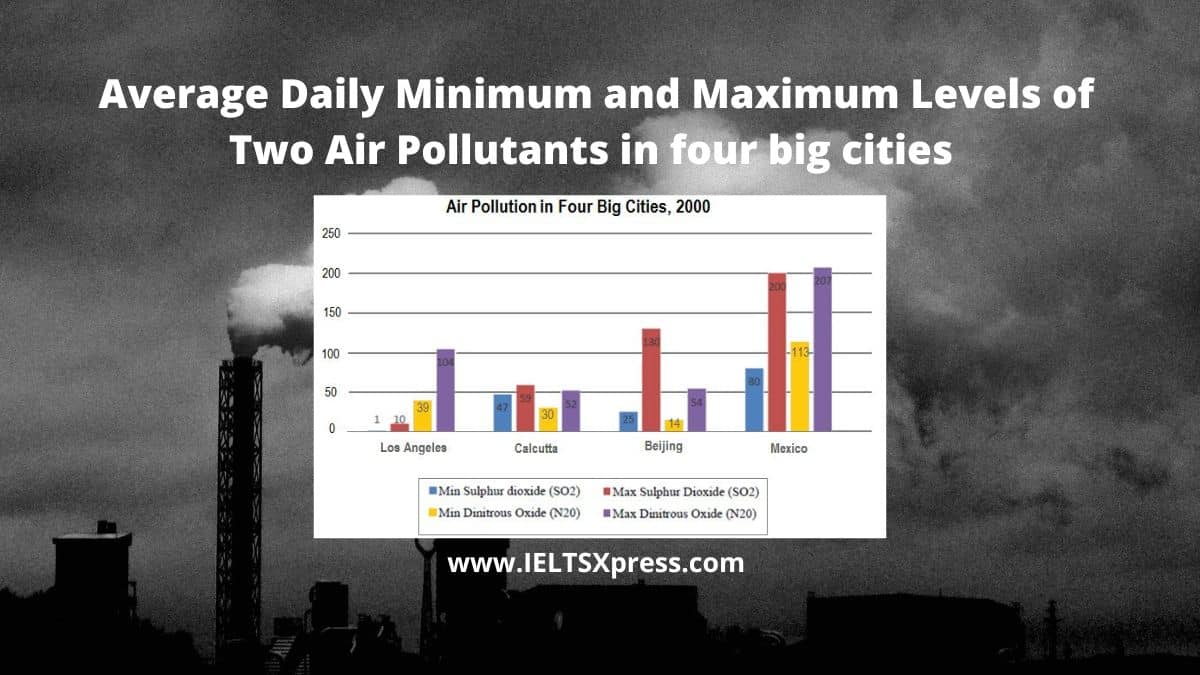
The chart below shows the average daily minimum and maximum levels of two air pollutants in four big cities in 2000 IELTS Academic Bar Chart.
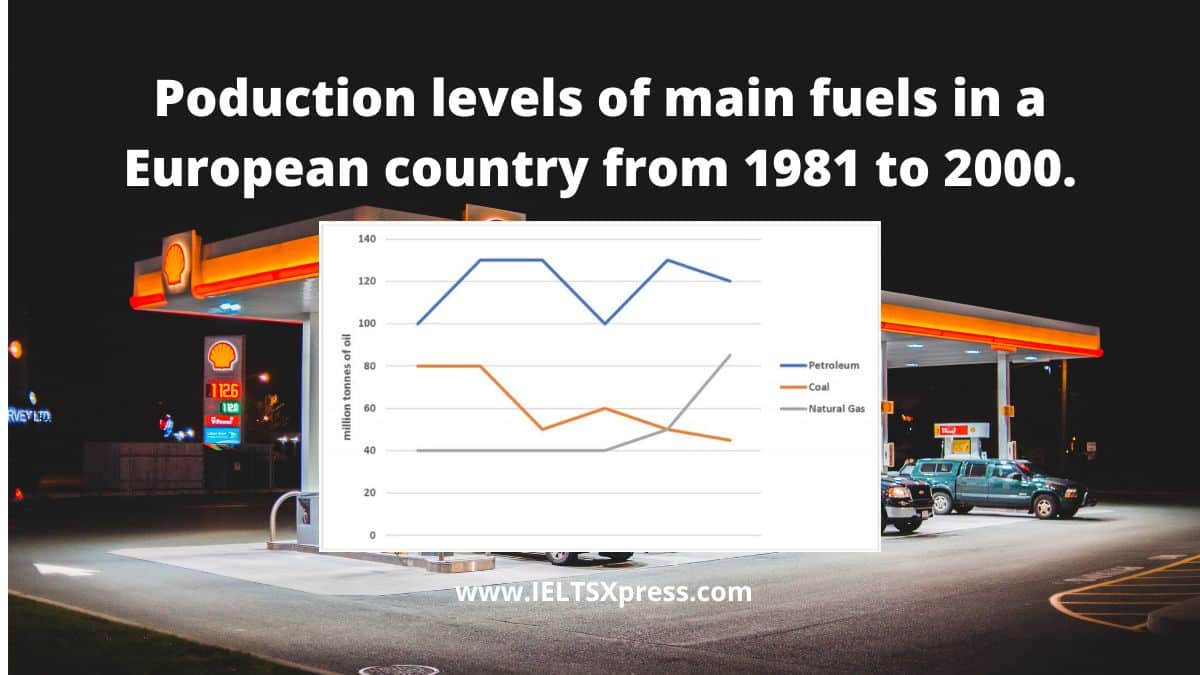
The graph below shows the production levels of main fuels in a European country from 1981 to 2000 Measured in tonnes IELTS Academic writing 1.

The charts below show the percentage of food budget the average family spent on restaurant meals in different years. The graph shows the number of meals eaten in fast food restaurants and sit-down restaurants.

The diagrams below show the water supply system in Australia present and in future. IELTS Process Diagram Academic Task 1 Sample Answer.

The line graph shows the percentage of different age groups of cinema visitors in a particular country from 1978 to 2008 IELTS Writing Task 1.
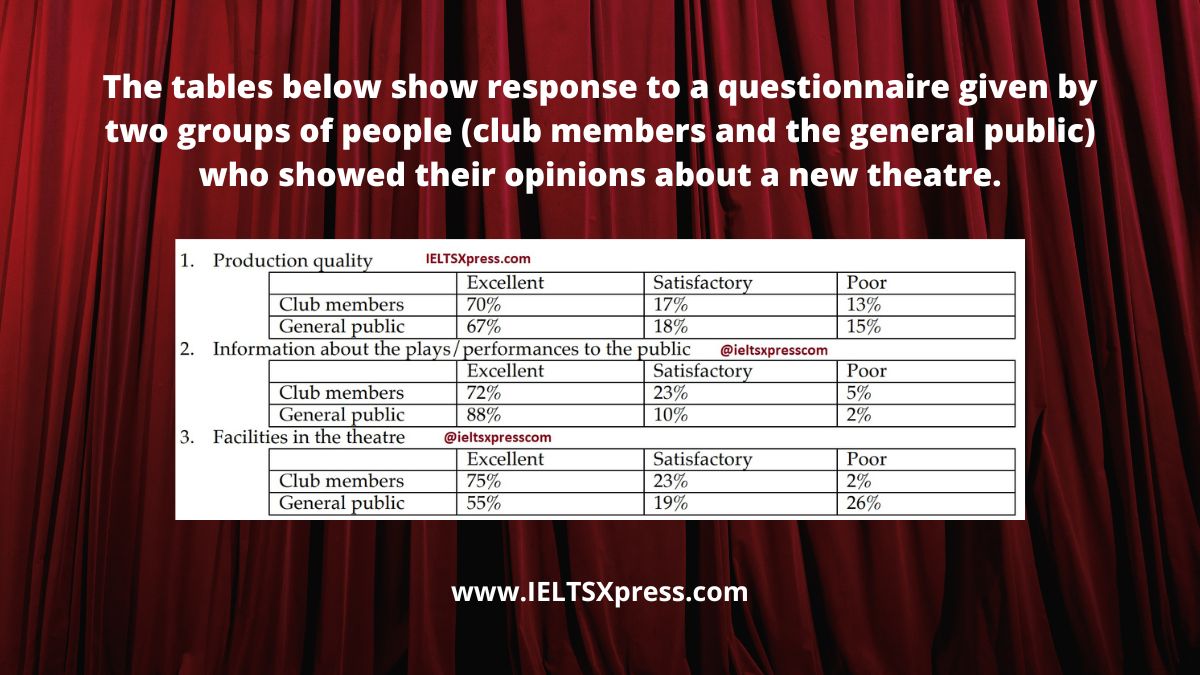
The tables below show response to a questionnaire given by two groups of people (club members and the general public) who showed their opinions about a new theatre.

The graph below shows the participation of Australian children in sports outside school hours in 2014. IELTS Academic Writing Task 1 Bar Chart.
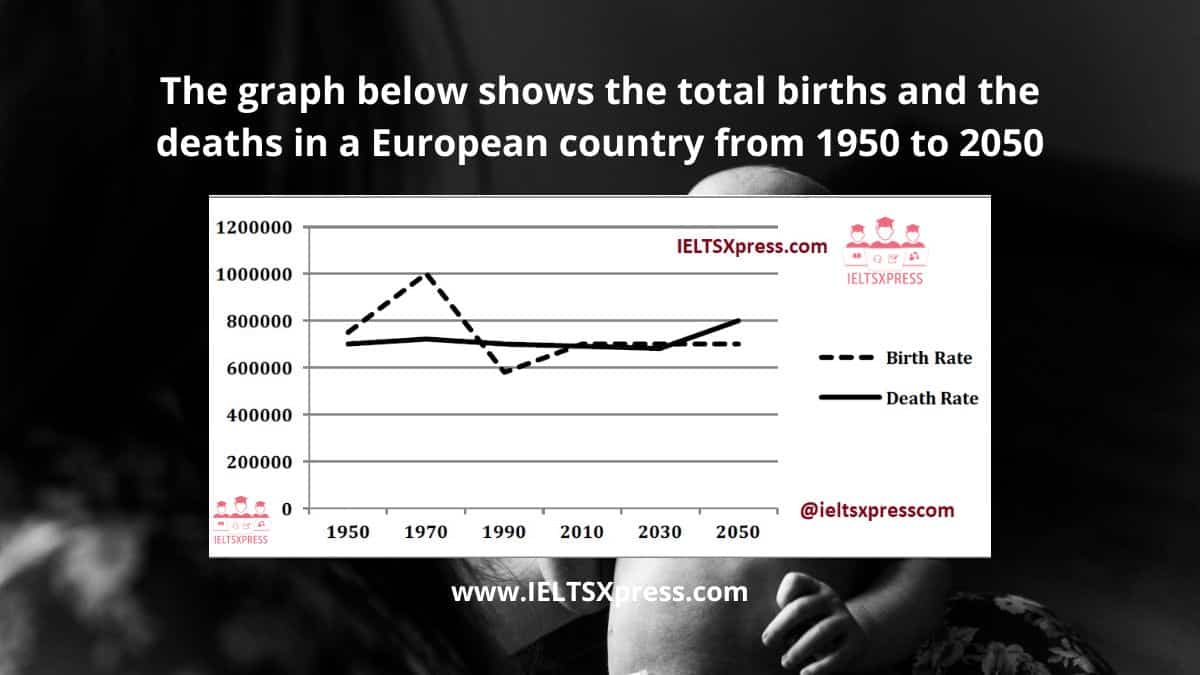
The graph below shows the total births and the deaths in a European country from 1950 to 2050 IELTS Line Chart Task 1.
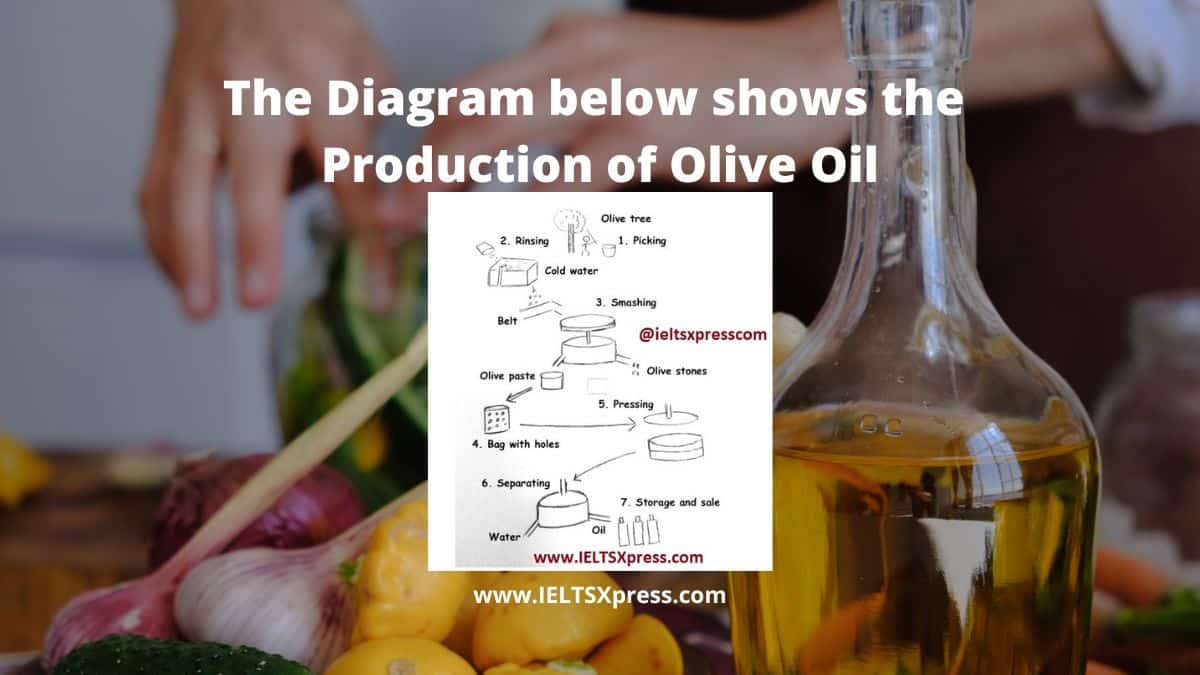
The diagram below shows the production of olive oil. Write a report for a university lecturer describing the information below. IELTS Process Diagram
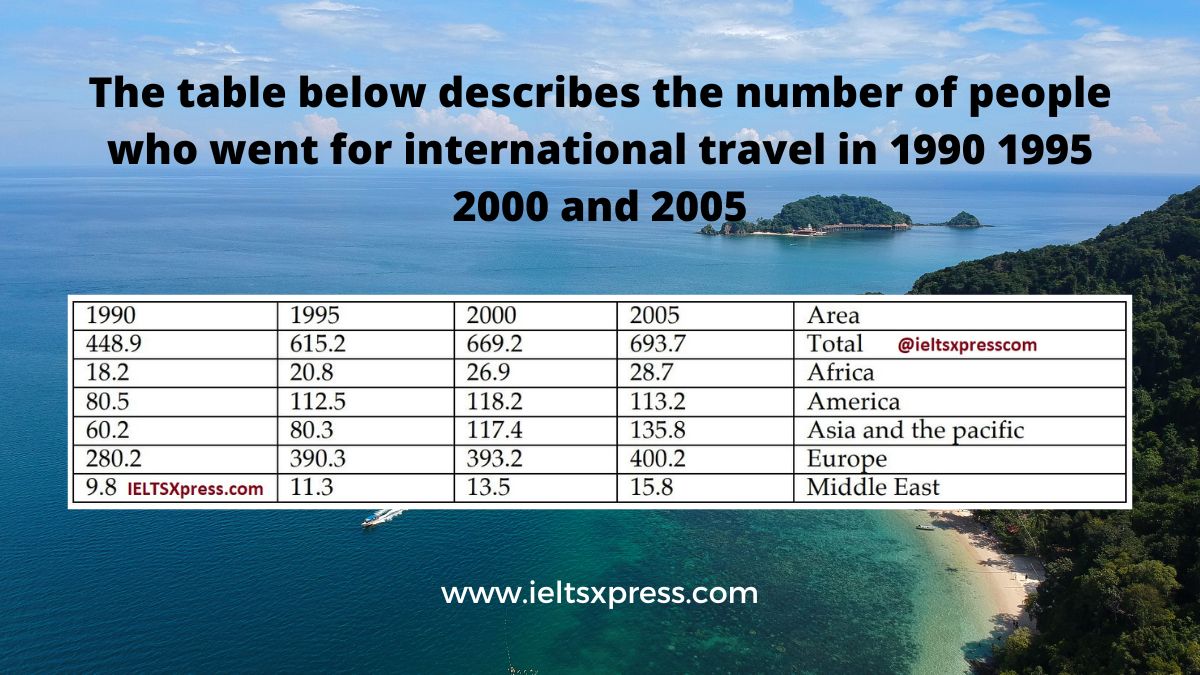
The table below describes the number of people who went for international travel in 1990 1995 2000 and 2005 (in million). IELTS Table Chart.
The maps show a road system as it is now and the proposed changes in future to reduce the number of accidents IELTS Academic Writing Task 1.