Number of Houses Built per Year in Two Cities – Bar Chart
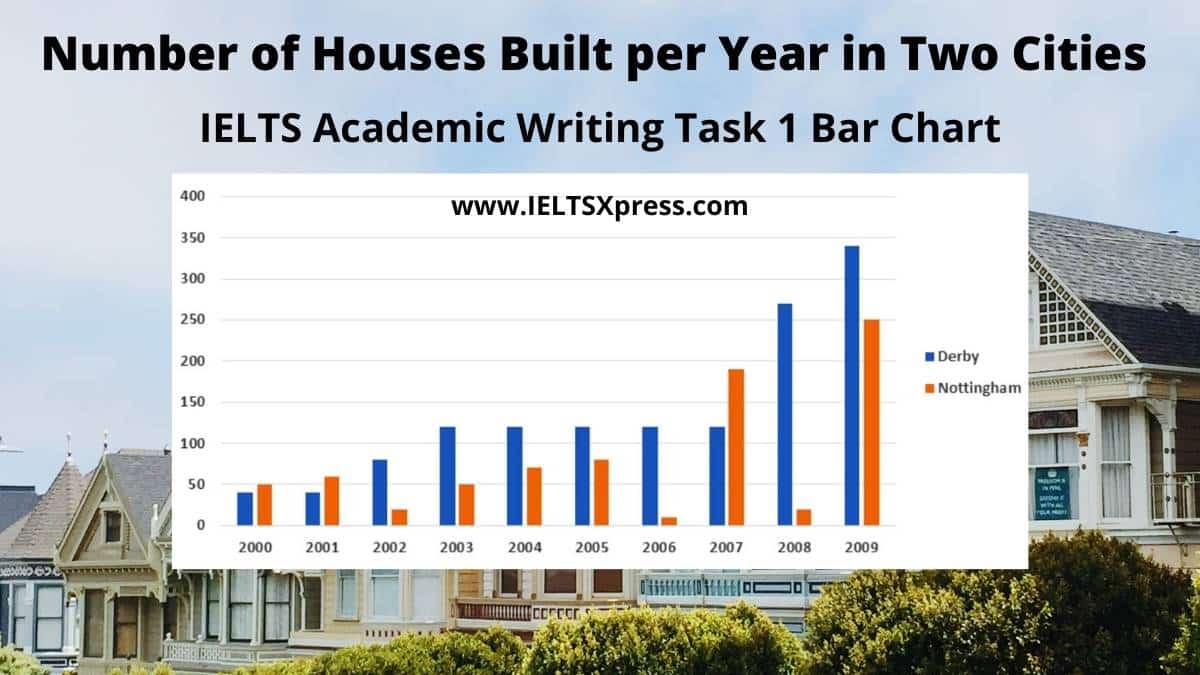
IELTS Writing Task 1 The bar chart below shows the number of houses built per year in two cities, Derby and Nottingham, between 2000 and 2009.
IELTS Writing Task 1 The bar chart below shows the number of houses built per year in two cities, Derby and Nottingham, between 2000 and 2009.

The chart shows the proportion of people in a UK survey carried out in three different years who said they were interested in certain sports.
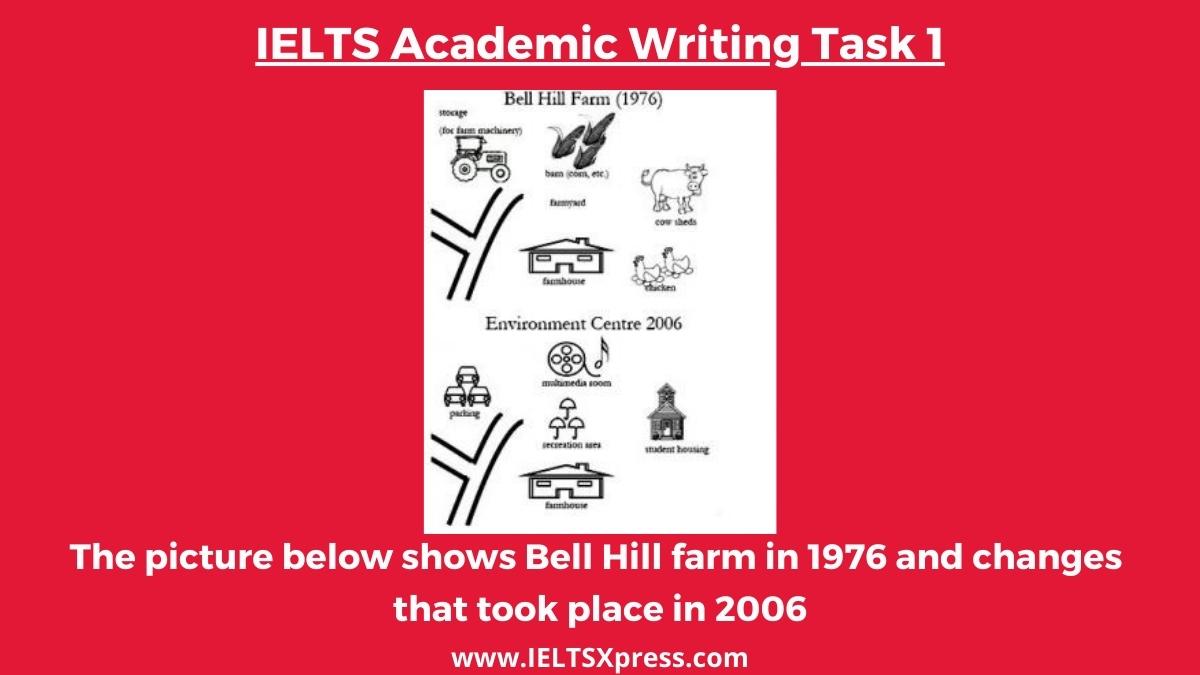
The picture below shows Bell Hill farm in 1976 and changes that took place in 2006. IELTS Academic Writing Task 1 Graph Writing. Bell Hill Farm.

The Chart below shows Annual Average Spending on Clothes per person in the US in 1985, 1995 and 2005 IELTS Writing Task 1 Bar Chart.

The bar chart below shows shares of expenditures for five major categories in the United States, Canada, the United Kingdom, and Japan in the year 2009

IELTS Academic Writing Task 1 The graph and chart below give information about the number of new graduates and their employment in the UK from 1992 to 2002.